Data Product
Prototyping with GenAI Tools - A Practical Guide for Data Product Managers
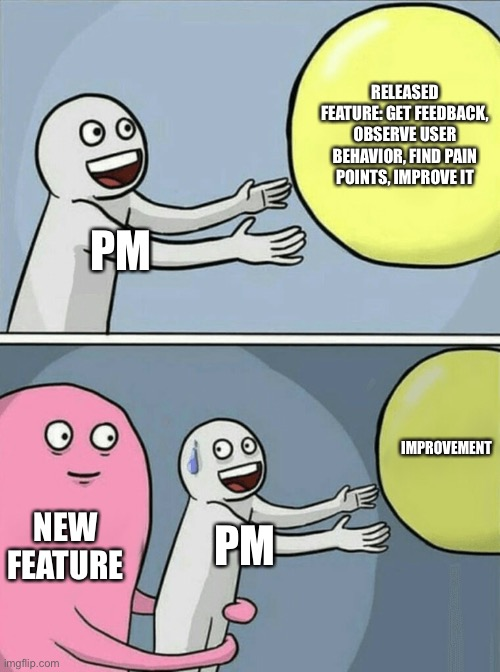
Data PMs face unique challenges: validating complex data relationships and schemas before building. This guide shows how to use GenAI tools to prototype data architectures, generate synthetic data, and test insights - condensing weeks of work into hours.
"In data product development, the cost of being wrong isn't just wasted time—it's wasted opportunity. With GenAI prototyping, we can now validate data assumptions in hours, not months."
Introduction
Data product managers face a unique challenge: efficiently validating complex data relationships, transformations, and visualizations without lengthy development cycles - you gotta build something of value that's sustainable too. GenAI tools are pretty cool i guess: allowing us to condense weeks of engineering effort into minutes. yea, that's nice
While general PMs benefit from faster UI prototyping and all of those fancy design sprints, DPMs can get something from these transformer supported tools too: the ability to validate complex data assumptions early. in this guide i'll share what i've seen work and you'll learn practical approaches to leverage GenAI for data product prototyping, with a focus on what makes our challenges unique

Why Prototyping Matters for Data Products
The Data Product Dilemma
Data products face a unique risk profile. Beyond the typical "Will users understand this interface?" question, data PMs must answer: "are we showing the right data?" "will these insights drive decisions?" "you sure about that chart there chad?!"
GenAI prototyping enables us to rapidly:
- Test visualization effectiveness with realistic data (hopefully realistic but that's on you too)
- Experiment with different data transformations
- Validate data schemas and relationships
- Simulate programmable interactions (API, connection protocols, or MCP actions these days)
A traditional PRD might specify: "The dashboard will show customer retention metrics with filters for segment and time period." But an interactive prototype reveals critical insights a static specification can't: Which visualization is clearest? What time granularity yields actionable insights? An interactive prototype answers these questions before committing to production code.
Key Challenges for Data PMs
unlike general PMs who focus primarily on interface elements, data PMs must address:
Data complexity: Data products involve relationships between multiple entities, transformations, and business logic that static mockups can't adequately represent.
Accuracy: A beautiful dashboard showing nonsensical data is worse than useless. Prototyping helps validate that algorithmic insights make sense.
Insight delivery: The biggest challenge is ensuring users understand and act on insights. Interactive prototypes reveal comprehension gaps that static designs miss.
📌 quick win: even a simple interactive data flow diagram built with GenAI can help stakeholders understand complex data relationships better than static documentation. ERD's only get you so far.
GenAI Prototyping Tools for Data Work
The GenAI prototyping landscape can be broken into three categories, each with specific strengths for data product work:
Chatbots (ChatGPT, Claude, Gemini, Grok, Deepseek)
- Best for: Quick data queries, generating sample datasets, simple code snippets
- Limitations: No persistent hosting, limited interactivity
- Data modeling strengths: Schema design suggestions, ERD generation, SQL DDL creation
- Real example: Using Claude to generate JSON datasets of customer transactions
Cloud IDEs (v0, Bolt, Replit, Loveable)
- Best for: Building interactive dashboards, mockable APIs, visualizations
- Data modeling strengths: Creating visual schema explorers, data lineage diagrams
- Top tool for data: Replit (excellent Python support for data work)
- Real example: Building a customer segmentation dashboard with filters and visualizations
Local Developer Assistants (Cursor, Copilot, Windsurf, Claude Code, Codex)
- Best for: Creating sophisticated data transformations, integrating with existing codebases
- Data modeling strengths: Generating migration scripts, building data pipelines, creating dbt models
- Limitations: Requires more technical knowledge
- Real example: Generating and refining synthetic data scripts
For data-specific work, each category has notable strengths. Chatbots excel at quick explorations and data generation but can't host interactive experiences. Cloud IDEs shine for end-to-end data experiences with persistent URLs for stakeholder feedback. Developer assistants offer the highest level of control for DPMs comfortable with code.

DPM insight: choose tools based on your prototype's data complexity, not just UI needs. simple dashboards work well in v0 or Bolt, but complex transformations might require Replit's Python capabilities.
Step-by-Step Workflows for Data Prototyping
From Design to Interactive Data Visualization
Process:
- Start with a dashboard design in Figma
- Extract the design into Bolt or v0
- Add interactive elements using realistic data
- Test with various data scenarios
Key Example: When prototyping a customer lifetime value dashboard, I took a screenshot of our Figma design and asked Bolt to recreate it:
Create a React dashboard that matches this design. It should have a header,
summary metrics showing total customers, average LTV, and retention rate,
and a main area with a bar chart showing customer value by segment.
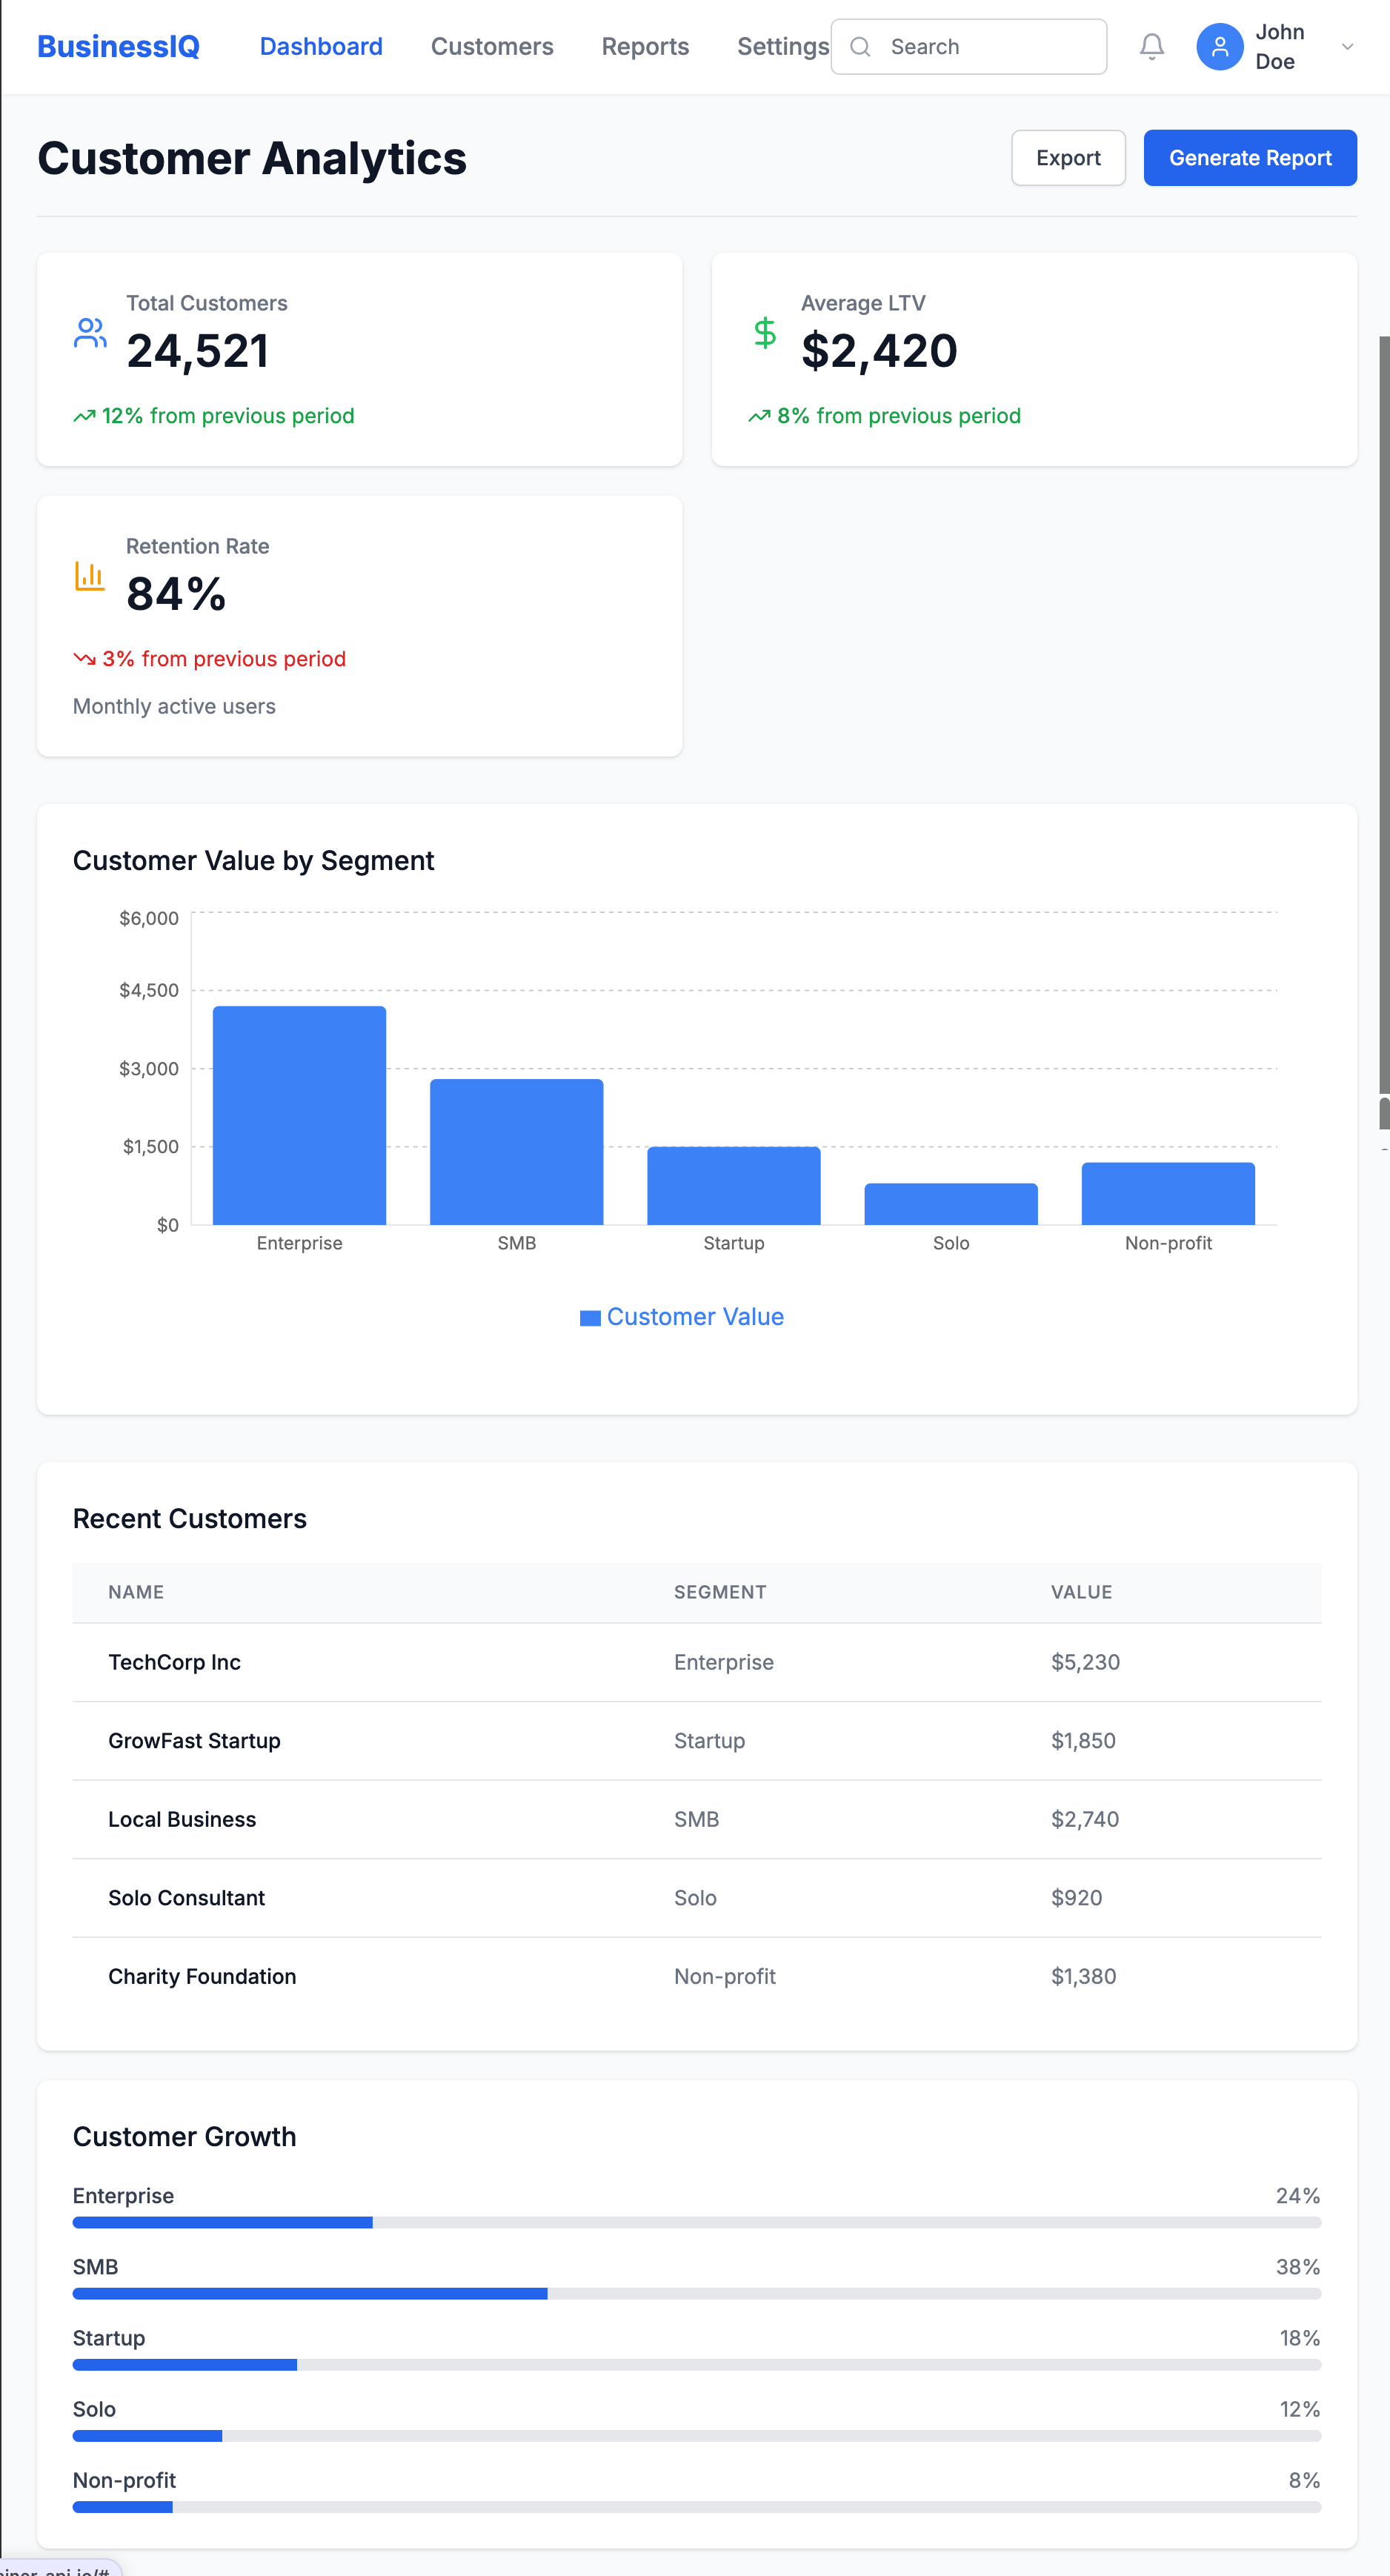
Then added interactivity:
Make the dashboard interactive with:
1. A date range picker that updates all metrics
2. Clickable segments showing detailed breakdowns
3. A CSV upload button for custom data visualization
This quickly revealed insights we'd missed in the static design:
- Users wanted side-by-side segment comparisons
- Year-over-year comparisons were essential
- Data validation for uploads was critical
From PRD to Data-Driven Prototype
Process:
- Extract key data entities from your PRD
- Define mock data schema using an AI assistant
- Build a functional prototype in a cloud IDE
- Test with real users to validate assumptions
Key Example: For a Sankey plot, I first used Claude to define a data schema that would support denormalized EHR data in a wide format. Then built a prototype in Replit that allowed toggling between schema orientation and it was able to implement rough Plotly visuals for this
The prototype revealed critical insights:
- Users were confused by attribution model differences
- We needed to visualize the customer journey alongside attribution
- Teams wanted to see how changing the attribution window affected results
For data products, the proof is in the insights. Focus your prototype on validating that users can understand and act on the data you're providing.
Generating Synthetic Data with GenAI
One critical aspect of data prototyping is generating realistic synthetic data. GenAI tools excel at:
- Volume & variety: Creating thousands of records with appropriate variations
- Format flexibility: Generating data in JSON, CSV, or SQL formats
- Pattern matching: Mimicking statistical distributions with the right prompting
- Range support: building with ranged and IQRs
However, they struggle with:
- Relational integrity: Maintaining consistency across related tables
- Domain accuracy: Ensuring specialized data (medical, financial) reflects real constraints
- Edge cases: Generating unusual but important scenarios
- Logical reliability: continuing that trend of relational extension through iterations
- Outlier building: Developing realistic and unrealistic outliers based on trajectories. For example, in marketing ad spend, a ROAS 10x the avg makes sense dependent on your Monthly Allocated Spend for small brands and scales negatively with budget - ad platforms flag this all the time but it happens!
Here's a sample prompt for limited synthetic data I used a couple of months ago:
Generate a synthetic healthcare claims dataset for prototyping, using open source standards.

Requirements:
- Use the HL7 FHIR Claim resource (or OMOP CDM’s visit_occurrence and drug_exposure tables) as the data model.
- Include 1,000 claims for 200 unique patients over a 12-month period.
- Each claim should have:
  - Patient ID (de-identified)
  - Provider ID
  - Service date
  - Diagnosis codes (ICD-10, 1-10 per claim)
  - Procedure codes (CPT, 0-5 per claim)
  - Drug codes (NDC or RxNorm, if applicable)
  - Total billed amount and paid amount
  - Payer type (Commercial, Medicare, Medicaid)
  - Claim status (Paid, Denied, Pending)
- Ensure realistic distributions (e.g., 70% Commercial, 20% Medicare, 10% Medicaid; 85% Paid, 10% Denied, 5% Pending).
- Vary service dates, codes, and amounts to reflect real-world patterns.
- Output as a CSV or JSON array, with field names matching the FHIR Claim resource (or OMOP table columns).
- Do not include any real patient data—generate all values synthetically.

Optional: Add a few edge cases, such as claims with unusually high amounts, missing diagnosis codes, or denied status due to invalid procedure codes.
key takeaway: the quality of your prototype is directly linked to the quality of your synthetic data. invest time crafting realistic data scenarios that include edge cases > get good at evals (I'll write more about that later but check this out for now --— Beyond vibe checks: A PM’s complete guide to evals
Diagramming & Data Flow Tools (e.g., Mermaid, dbdiagram.io, Lucidchart)
Best for:
- Visualizing data models, entity relationships, and data flows before building
- Communicating architecture and logic to both technical and non-technical stakeholders
- Rapidly iterating on schema or pipeline designs
How to use:
- Use tools like dbdiagram.io to quickly sketch ERDs (Entity Relationship Diagrams) for your data models.
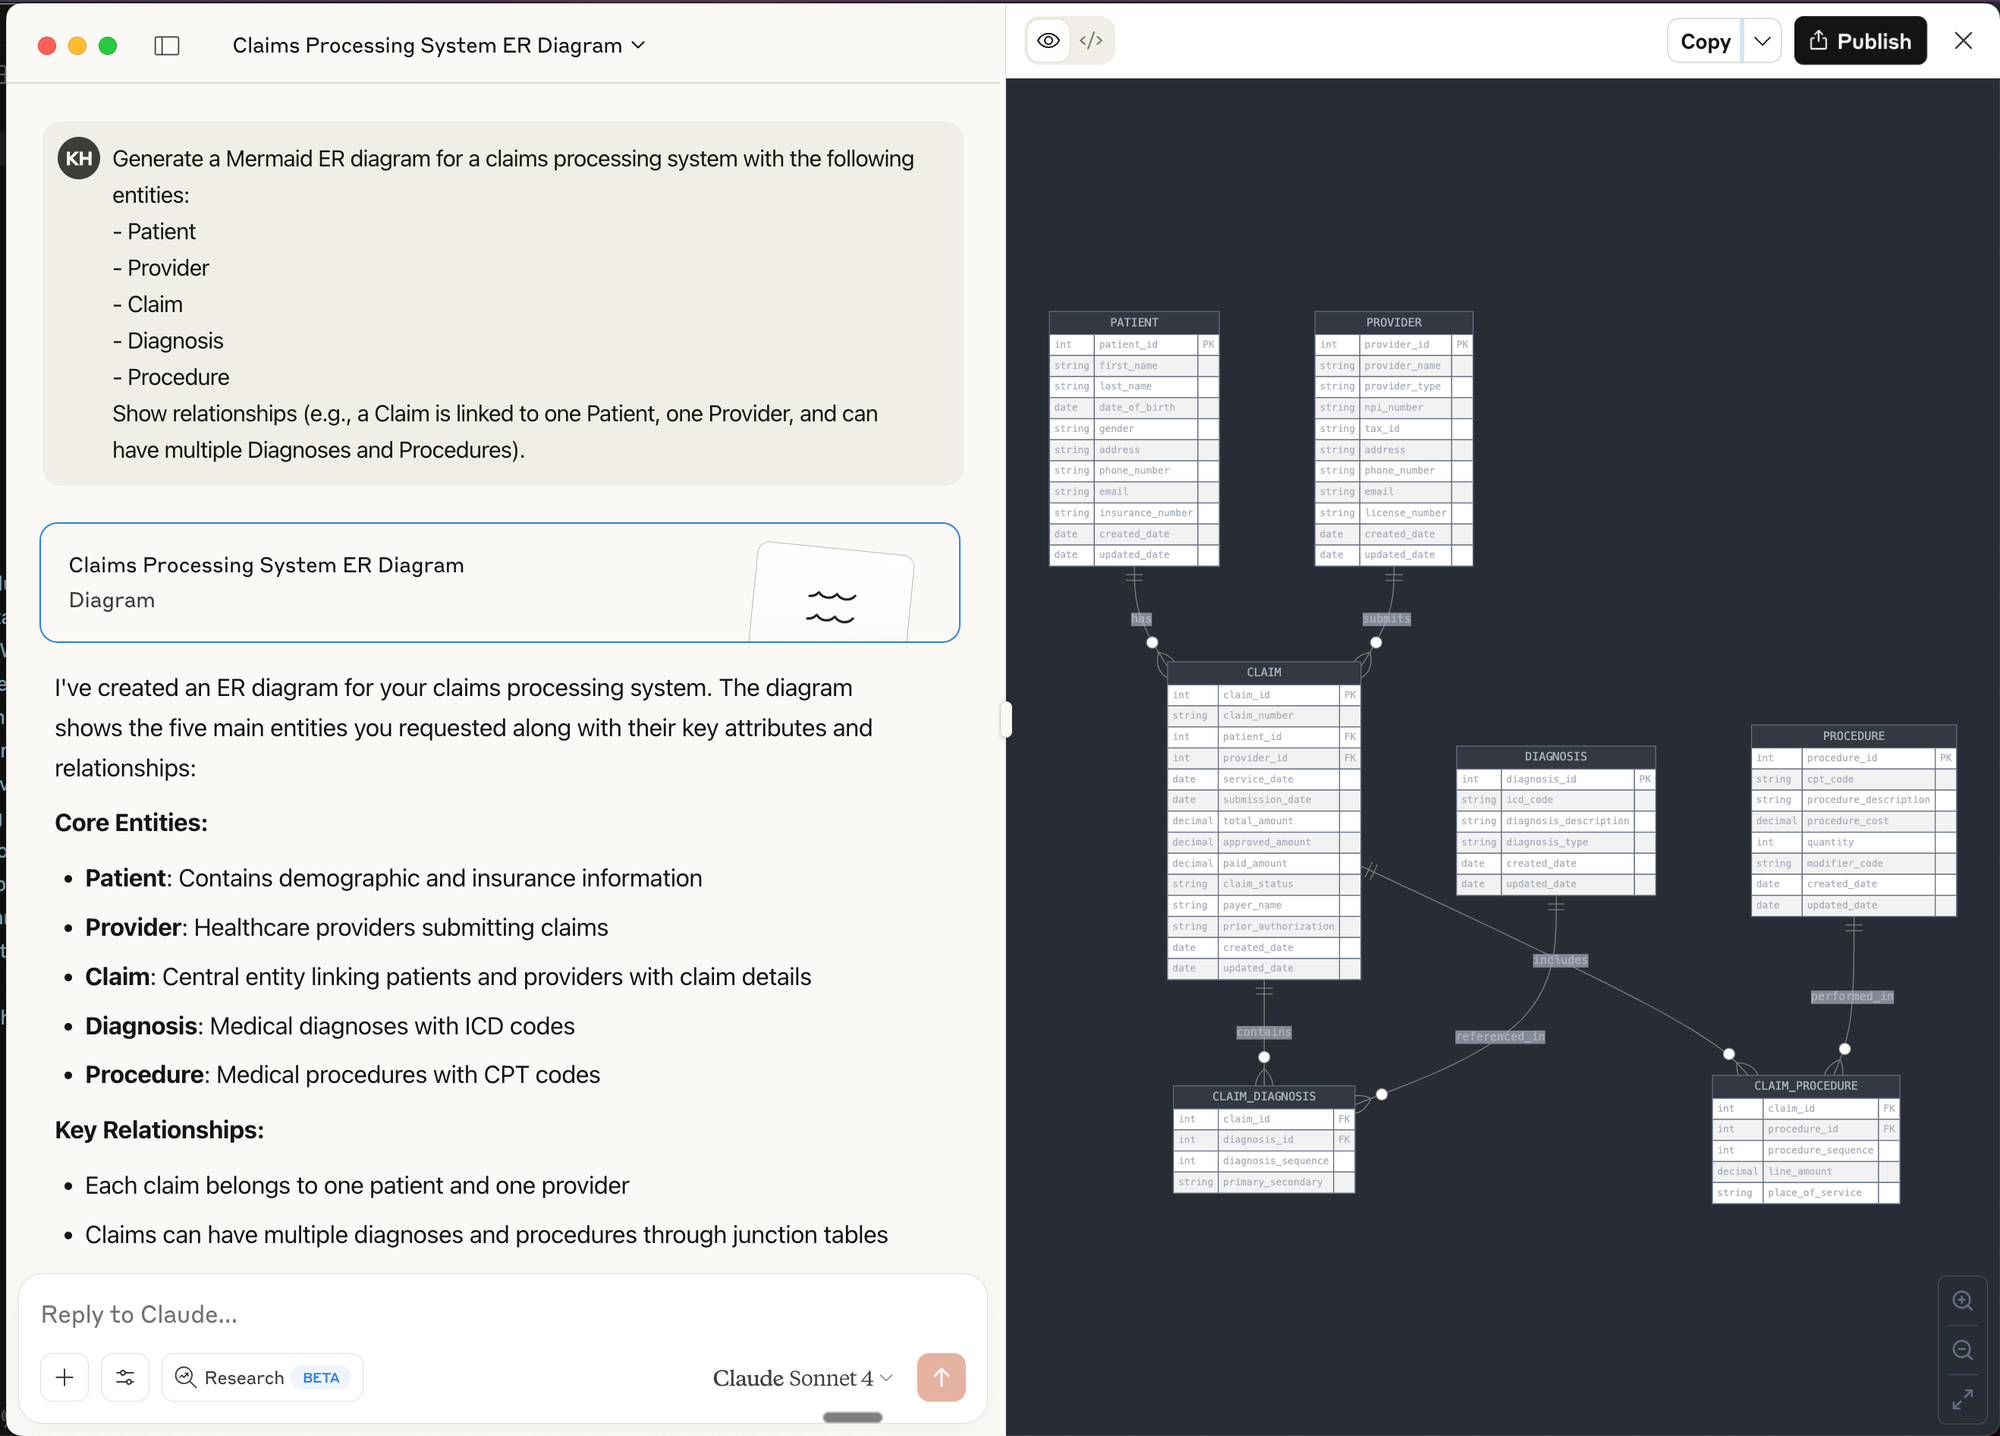
- Use LLM chat interfaces to create Mermaid diagrams (supported in many markdown editors and wikis) to generate flowcharts, sequence diagrams, and even Gantt charts directly from text prompts.
Prompt Example for Mermaid:
Generate a Mermaid ER diagram for a claims processing system with the following entities:
- Patient
- Provider
- Claim
- Diagnosis
- Procedure
Show relationships (e.g., a Claim is linked to one Patient, one Provider, and can have multiple Diagnoses and Procedures).
Prompt Engineering for Data Prototyping Success
The quality of your prompts directly impacts prototype quality. For data work, follow this framework:
Reflection: Start by asking the AI to analyze requirements before writing code.
Based on this data schema, what potential issues should I watch for when designing
a time-series visualization? Consider null values and sparse data periods.
Batching: Break complex data tasks into smaller components.
Let's build this dashboard in stages:
1. First, define the data model
2. Next, create the aggregation logic
3. Then build the visualization component
4. Finally, add filtering capabilities
Specificity: Be precise about data structures and transformations.
Generate a histogram showing user session lengths. The data will be:
[{ "session_id": "s12345", "duration_seconds": 320, "page_views": 4 }, ...]

Group durations into 30-second buckets with tooltips showing count and range.
Context: Provide business context and examples.
In hospital EHR data, friday night visits to ED are typically 30% higher than weekdays, and
morning hours (0730-1100) see peak traffic. Generate sample data matching these patterns.
Common pitfalls to avoid:
- Underspecifying data formats: Vague requests lead to outputs that don't match your needs
- Unclear relationships: Specify how entities relate (one-to-many, etc.)
- Vague data requirements: Include specific distributions, ranges, and business rules
Real-World Case Studies
Rapid Dashboard Prototype for Stakeholder Alignment
Challenge: Our team needed buy-in for a new customer health score methodology.
Approach: Created an interactive dashboard in v0 where stakeholders could adjust factor weights and see how scores changed for different customer segments.
Result: Instead of weeks of theoretical debate, we achieved alignment in two days. Stakeholders discovered we needed to normalize scores by customer size—something we would have missed without the interactive experience.

Validating a New Data-Driven Feature
Challenge: We hypothesized users would value a new "composite symptom" metric against multiple scales in our healthcare dataset.
Approach: Built a Replit prototype that allowed users to:
- View their simulated score
- See the calculation methodology
- Explore how behavior changes would affect their score
- Compare against benchmarks
Result: We discovered:
- Users valued the concept but needed more contextual information
- Comparisons to similar users mattered more than absolute scores
- The term "efficiency" confused users; "productivity impact" resonated better
- Users wanted actionable recommendations based on the score
These insights saved months of development on a feature that would have missed the mark.
Actionable Takeaways for Data PMs
Tool Selection Framework
Use chatbots for:
- Quick data exploration
- Simple data generation
- Single-use code snippets
Use cloud IDEs for:
- Shareable interactive prototypes
- Data visualizations with filtering
- End-to-end simulated experiences
Use developer assistants for:
- Complex data transformations
- Integration with existing code
- Production-quality implementations
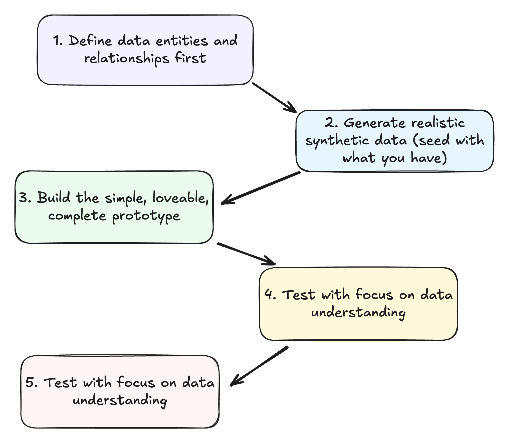
The Data Prototype Workflow
- Define data entities and relationships first
- What objects comprise your data model?
- How do they relate to each other?
- Generate realistic synthetic data
- Include common patterns and edge cases
- Ensure data reflects business realities
- Build the minimum viable prototype
- Focus on validating key assumptions
- Make it just interactive enough to test your hypothesis
- Test with focus on data understanding
- Can users derive meaningful insights?
- Do they understand what metrics mean?
- Iterate based on data value feedback
- Refine the data model based on insights
- Adjust visualizations to better communicate meaning
De-risking Data Products Through Prototyping
Leverage GenAI prototypes to validate:
Data assumptions: Test whether your understanding of the data is correct before building.
User value: Confirm insights actually solve user problems in a meaningful way.
Technical feasibility: Verify your proposed architecture will work as expected.
Stakeholder alignment: Build consensus through interactive demonstrations that make abstract concepts tangible.
success story: "We used to spend 3 weeks building data visualization prototypes. With GenAI tools, we reduced that to 2 days, and the quality of feedback improved because stakeholders could interact with real data." - VP Data, Health System

Further Resources & Next Steps
Learning Resources:
- Streamlit Documentation - For building data apps in Python/replit
- Observable - Interactive data visualization playground
- "Storytelling with Data" by Cole Nussbaumer Knaflic
- GenAi prototyping for product managers
- Anthropic - prompt engineering overview
- Ideo - Prototyping Overview
- Beyond vibe checks: A PM’s complete guide to evals
Take Action Today:
- Create a simple dashboard prototype using v0 or Bolt
- Practice generating synthetic data with Claude or ChatGPT
- Share your prototyping experiments with your team - don't be afraid but yes, they might laugh at you
Beyond the Product Trio - Why Data Products Need a Squad
Data products need more than a trio.
Growth is driven by compounding, which always takes time. Destruction is driven by single points of failure, which can happen in seconds, and loss of confidence, which can happen in an instant. - Morgan Housel, Psychology of Money
The Team Behind Market Profiler
In my second year at Revive, I was tasked with turning a one-off healthcare market analysis project into a scalable product offering. We'd delivered a bespoke market analysis to a regional health system that had generated significant strategic impact, and leadership wanted to create a repeatable data product that could be sold to multiple clients.
Armed with a PowerPoint, Tableau workbook, and an analyst who'd crafted some impressive Alteryx/Python data pipelines, we gathered to map a way forward
The kickoff meeting included our typical product development cast: me as Product Manager, a Tech Lead responsible for implementation, and a Design Lead to craft the user experience. This tried-and-true "Product Trio" had successfully launched numerous healthcare marketing campaigns and products before.
But something wasn't clicking.
"How confident are we in the predictive model's accuracy across different market types?" asked the Tech Lead.
"What about demographic blind spots? Rural markets have different data coverage than urban ones," noted the Designer.
"And the ethical implications of giving health systems competitor intelligence? What are the elements missing between the claims, EHR, and other data sources we are considering? Are we sure about this?" I wondered aloud.
While I had the coverage and experience previously, I needed support and deep data expertise. Not just coding skills or database knowledge, but someone who who had seen healthcare data's nuances, limitations, and ethical boundaries.
The next week, I added a Data Lead to our core team - a data engineer. We moved faster and with more certainty from then on.
This was top of mind when building the next product and the team supporting it. We needed more than the standard trio of leads - we needed a squad.
The Traditional Product Trio
For years, the product development world has operated with a well-established core team structure known as the Product Trio:
- Product Manager: The voice of the market, business, and strategic direction
- Tech Lead: The technical feasibility and implementation expert
- Design Lead: The user experience and interface architect
As Teresa Torres describes it, "A product trio is typically comprised of a product manager, a designer, and a software engineer. These are the three roles that—at a minimum—are required to create good digital products."
This triad works beautifully for traditional software products. The PM understands what to build, the Tech Lead knows how to build it, and the Design Lead ensures it's intuitive and enjoyable to use.
For a typical SaaS product, this structure covers the essential disciplines needed to take a product from concept to market. Technical feasibility questions focus on software engineering challenges: Can we build this feature? How long will it take? Will it scale?
But data products are different beasts entirely.
Enter the Data Product Squad
Data products—whether dashboards, predictive models, recommendation engines, or AI-powered tools—have unique complexities that the traditional trio isn't equipped to fully address.
Enter the Data Product Squad:
- S: Strategic
- Q: Quality-focused
- U: User-centered
- A: Analytical
- D: Data-driven
At its core, the Squad consists of four essential leaders:
- Product Manager: Still the market and business expert, but with awareness of data's unique challenges
- Tech Lead: Focused on system architecture, API design, and overall implementation
- Design Lead: Creating interfaces that make complex data intuitive and actionable
- Data Lead: The data science, engineering, and ethical governance expert
The Data Lead isn't an optional add-on or a nice-to-have consultant. They're an essential fourth pillar in data product development—equal in importance to the other three roles.
The Five Risks of Data Products
Why is this fourth role so critical? Because data products face a risk profile fundamentally different from traditional software.
In his classic work on product risk, Marty Cagan of Silicon Valley Product Group discusses the "Four Big Risks" that all product teams must address:
- Value risk: Will customers buy it or users choose to use it?
- Usability risk: Can users figure out how to use it?
- Feasibility risk: Can our engineers build what we need with the time, skills, and technology we have?
- Business viability risk: Does this solution work for the various aspects of our business?
For traditional products, the Product Trio maps cleanly to these risks:
- The Product Manager addresses value and business viability risks
- The Designer handles usability risk
- The Tech Lead tackles feasibility risk
But data products introduce a fifth critical risk:
5. Ethical Data Risk
This encompasses:
- Accountability for algorithmic decisions
- Representativeness of data
- Fairness across populations
- Transparency and explainability
- Data privacy and governance
- Long-term impact and unintended consequences
This fifth risk doesn't map neatly to the traditional trio. While product managers might understand the business implications, designers might consider the user experience impact, and engineers might recognize some technical limitations, none are typically equipped to fully own this critical risk dimension.
That's where the Data Lead becomes essential.

Technical Feasibility Risk (Reimagined)
Even the nature of feasibility risk is different for data products:
In traditional software development, technical feasibility usually centers on engineering challenges: Can we build this feature? How much will it cost? How long will it take?
For data products, feasibility questions are more complex:
- Do we have enough high-quality data to train this model?
- Can we get acceptable accuracy across all key demographics?
- Is real-time prediction possible given our infrastructure?
- How do we handle data drift over time?
These questions require deep expertise in data science, data engineering, and the specific domain's data landscape. A traditional Tech Lead, while brilliant in software engineering, often lacks this specialized knowledge.
Ethical Risk (Expanded)
The ethical dimension permeates data products, especially those using AI/ML:
- Are we accidentally encoding bias in our algorithms?
- Are our recommendations creating harmful incentives?
- Do our visualizations inadvertently mislead users?
- Are we properly protecting sensitive data while still deriving value?
- Can we explain how our model makes decisions?
- Do we have proper measures to monitor, detect, and mitigate failures?
These aren't just hypothetical concerns—they're existential risks for data products. One ethical misstep can destroy trust permanently.
As the quote at the beginning reminds us: growth compounds slowly, but destruction can happen in an instant. For data products, that destruction often stems from ethical oversights that a traditional product team might miss.

Market Profiler: The Squad in Action
Returning to our Market Profiler example, adding a Data Lead transformed our approach in several crucial ways:
First, our Data Lead immediately identified critical limitations in our demographic data sources. Rural zip codes had significantly less reliable commercial data than urban ones, creating a blind spot that could lead healthcare clients to underinvest in underserved communities. We hadn't fully recognized this issue in our one-off project, but scaling it as a product would have magnified the problem.
Second, he challenged our machine learning approach for predicting service-line growth opportunities. Our initial model used classic propensity scoring, but she demonstrated how this could inadvertently prioritize wealthy, well-insured patients over those with greater needs. We pivoted to a more balanced methodology that considered both commercial opportunity and community health impact.
Finally, he designed a data governance framework that allowed us to provide competitive intelligence without crossing ethical boundaries around protected health information. This included specialized aggregation techniques that prevented reverse-engineering of sensitive metrics.
The result? Market Profiler evolved from an interesting analytics project into a responsible, ethical data product that hospitals could confidently use for strategic planning. Within a year, we had signed contracts with a half dozen health systems—far exceeding our original projections.
The NeuroBlu Experience
At Holmusk, I witnessed a similar pattern with our flagship product, NeuroBlu Analytics. When I joined, the team was structured around the traditional Product Trio model, with data scientists consulted as needed but not integrated into core decision-making.
Early versions of the product faced challenges:
- Data models were technically sound but difficult for non-technical healthcare researchers to use
- Visualizations were beautiful but sometimes misrepresented statistical significance
- The platform excelled at showing correlations but offered little guidance on causation risks
As we evolved toward a Squad approach, with a dedicated Data Lead as a core team member, these issues began to resolve. The Data Lead became our ethical compass, constantly asking questions like:
- Are we providing enough context for these findings?
- Could this visualization lead researchers to draw inappropriate conclusions?
- Are we properly communicating the limitations of real-world evidence?
This shift accelerated our platform's adoption among life science companies—groups that need a ton of support to over come general skepticism of our commercial real-world evidence approach. They recognized and respected the ethical rigor our Data Lead brought to the product.
Building Your Own Data Product Squad
If you're developing a data product, how do you implement the Squad approach?
1. Elevate data expertise to leadership level
The Data Lead isn't just a technical contributor—they need authority equal to the other leaders. They should be present for strategic decisions from day one, not consulted afterward.
2. Look for T-shaped data expertise
The ideal Data Lead has depth in one area (e.g., data science, data engineering, data visualization or data governance) but breadth across the entire data lifecycle. They should understand enough about each area to identify risks and ask the right questions.
3. Value domain knowledge
Domain expertise is particularly critical for the Data Lead. In healthcare, for instance, understanding HIPAA, clinical workflows, and healthcare economics is as important as technical skills.
4. Create clear decision rights
Define which team member has final say in which areas. The Data Lead should have veto power on issues of data quality, model performance, and ethical use.
5. Establish data ethics principles
Work as a Squad to define ethical boundaries before you're faced with difficult tradeoffs. Document these principles and review them regularly.
The Future of Data Product Teams
Marty Cagan recently published a thought-provoking vision for how AI might reshape product teams, predicting that "product discovery will become the main activity of product teams, and gen ai-based tools will automate most of the delivery."
But even in this AI-accelerated future, Cagan still sees the need for specialized roles: "product teams will need a product manager to solve for the many business constraints, a product designer to solve for the user experience, and an engineer to solve for the technology."
For data products, I'd argue the same logic applies to the Data Lead. As AI becomes more integrated into products of all types, the need for data expertise at the leadership level will only grow, not diminish.

The line between "regular products" and "data products" will continue to blur. Eventually, all digital products may need something like the Squad approach.
But for now, if you're explicitly building a data product—particularly one that uses machine learning, predictive analytics, or works with sensitive information—the traditional Product Trio isn't enough.
You need a Data Product Squad, with the Data Lead as an essential fourth pillar.
Because data products don't just carry technical and market risks—they carry ethical risks too. But at the end of the day - not much is different. You still need to figure out what and how to build and distribute something that users value.

The Questions Nobody's Asking
- How do we measure the impact of ethical data product decisions on long-term customer trust?
- What skills and training do Product Managers need to work effectively with Data Leads?
- How does the Squad approach scale across multiple product teams in larger organizations?
- In an AI-augmented future, will the Data Lead become even more critical as ethical risks multiply?
- How do we balance innovation speed with ethical risk management in data product teams?
Would love to hear your thoughts. Have you seen the need for a dedicated Data Lead on your data product teams? What challenges have you faced when developing data products with traditional team structures?
Growth is driven by compounding, which always takes time. Destruction is driven by single points of failure, which can happen in seconds, and loss of confidence, which can happen in an instant. - Morgan Housel, Psychology of Money
Working with data requires holding two things true at once. You must constantly investigate, experiment, and explore while building certainty, understanding, and stability. It’s about trust. Bringing some order to chaos which is what data is.
General product management - a vague notion I know but think of any physical product or technical service - relies on the former truth with the latter coming as the investigation comes to a close.
When building with data, there is always something new with your input. The ground is shifting under your feet. It makes sense to flow with it.
Over the years of building data products and teams, I’ve found a couple of differences. Not massive but real. And worth talking about.
Core Focus & Responsibilities
- User-Centric DNA: Everything revolves around user needs and experiences
- Broad Scope: Lives at the intersection of engineering, business, and UX
- Qualitative Decision-Making: Heavy reliance on user feedback and market insights
Data Product Management:
- Data-Centric DNA: Data shapes every decision and feature
- Specialized Scope: Operates where engineering, business, and data meet
- Quantitative Decision-Making: Lives and dies by metrics and experiments
This is a dramatic simplification. A data product manager is a product manager first. Jason Cohen writes, “the role centers on deciding what to build.” It’s deceptively simple and a data product manager has to do the same. The difference lies in the material and constraints.
A SaaS PM is product focused and while they have to manage the business viability risk (can the business support and benefit from this product), they often have fewer hard constraints on what to build with.

The Skills Gap That Actually Matters
General PMs need:
- Market research chops
- Customer development expertise
- Business strategy understanding
- Basic technical knowledge
In addition to those core things, Data PMs require:
- Reasonable data science understanding
- Machine learning/AI experience
- Data governance appreciation
- Analytics proficiency
This is asking a lot of one person. True. Add in some element of data expertise and you have a future founder on your hands.
The demands are impossible. The job is technically impossible. That's why you are on a team. It's not on you but you need to bring context, creativity, and an ability to coach.
Team Dynamics & Collaboration
General PM Teams often include:
- Cross-functional squads (engineers, designers, marketers) helmed by the Product Trio (PM, Tech Lead, Design Lead)
- Customer feedback drives development
- Focus on feature shipping and user adoption
Data PM Teams:
- A similarly cross-functional squad but helmed by a Product Quad (Data PM, Tech Lead, Design Lead, and Data Lead) with data-centric specialists (data scientists, data engineers, analysts) added in
- Data quality drives development
- Focus on data accessibility and democratization
Data products are inherently more complex. Especially if they are B2B which 90% of them are. Balancing the quality risk along with the other four (value, usability, feasibility, and business viability per Marty Cagan) is just icing on the cake.
The Healthcare Reality Check
In healthcare, these differences become even more pronounced. When I was leading data product at Revive, we weren't just shipping features - we were shipping trust. We had to build the story for our healthcare partners while still maintaining strict controls on protecting patient data.
Healthcare B2B is "playing on hard mode". Building a data product in a regulated industry like US healthcare requires a focus on quality risk above all else.
Four Key Shifts That Nobody Talks About:
- The Risk Profile
- General PM: Ship (potentially) buggy code, push a fix
- Data PM: Ship bad data, lose trust forever
- The Success Metrics
- General PM: Usage, engagement, retention
- Data PM: Data quality, decision velocity, trust signals
- The Customer Journey
- General PM: "Wow, this is great!"
- Data PM: "I don't trust this yet... but maybe..."
- The Team Dynamic
- General PM: "When can we ship?"
- Data PM: "How do we validate?"
Looking Ahead
As AI and ML become ubiquitous, these roles will continue to merge. But the fundamental differences in approach - particularly around risk, trust, and validation - will remain critical. As noted in the lead quote, growth is compounding, in markets and products, but trust can be lost in an instant.
Every product will have data components. But not every product will be a data product. Understanding this distinction will be an important skill for the next generation of PMs.
The Questions Nobody's Asking
- How do we measure trust as a product metric?
- What does "move fast and break things" look like when data quality is non-negotiable?
- How do we build data products that balance innovation with reliability + trust?
Would love to hear your thoughts. What differences have you noticed between Data PM and General PM roles in your work?
What Meta's 2025 Restrictions Mean for Data and Product Leaders
Meta's new healthcare ad restrictions aren't just another privacy update - they're a fundamental shift in how we'll have to think about healthcare growth. Drawing from my years measuring health system campaigns at Revive Health, I break down what this means for data and product leaders, why CDPs mig
Risk is what you don’t see.
In 2021, when Apple dropped iOS 14.5 along with App Tracking Transparency (ATT), the digital advertising world scrambled. Folks adapted. But Meta's latest announcement about healthcare advertising restrictions feels different. More targeted - pun intended.
I spent years at Revive (FKA Revive Health) building and measuring ad campaigns for health systems. The game was always about precision - finding the right patients, measuring conversions, optimizing spend all while preventing patient health information (PHI) exposure. We obsessed over metrics like cost-per-acquisition and return on ad spend (ROAS).
But starting January 2025, that playbook is going through another big shift.
What's Actually Happening
Two weeks ago, Meta quietly dropped some shocking news on healthcare/healthtech advertisers. Through a series of targeted emails, they announced two levels of restrictions:
- Fully restricted: Healthcare provisioning properties (think patient portals, app domains)
- Partially restricted: Healthcare marketing properties (corporate sites, lead forms)
The key impact? If you're in healthcare/healthtech, you likely won’t be able optimize for conversions anymore - at least not native in Meta Business Portal. No more tracking form fills. No more measuring patient acquisition costs. No more retargeting based on specific conditions or treatments.
Note: There are a ton of unknowns for everybody and folks are trying to get straight answers so all of this may be irrelevant in a couple of weeks.
As Chris Turitzin noted in last week’s Health Tech Nerds roundtable:
”If you're not able to send low funnel events, that changes everything in the way that you run meta campaigns... trying to run non-conversion optimized meta campaigns will understand that they just don't work from a profitability stance."
Why Now?
This isn't just Meta being cautious out of the blue. As Yulie Klerman, former LiveRamp healthcare lead explained during the roundtable: "We've seen changes in the last 4 years and specifically the last on the state privacy regulation in the states. When they explicitly call out healthcare information... they're getting closer to GDPR."
The writing has been on the wall. GoodRx's FTC settlement. The HHS guidance on tracking technologies. The proliferation of state privacy laws.
Inside the War Room: Notes from Yesterday's HTN Roundtable
Sometimes the best insights come from rooms full of people trying to solve the same problem. Last Tuesday’s Health Tech Nerds roundtable felt like a war room planning session - equal parts strategy meeting and group therapy. With so much still unknown, it was a bit similar to an OpSec briefing with panelists and folks trying to get a sense of the “known knowns” and the “known unknowns”.
Four patterns emerged that tell the story:
1. The Platform Pivot
”Shift to top of funnel video," Brian advised, sharing wins from brand lift studies. "We know it works."
But it's not that simple. Moving up the funnel isn't just a tactical shift - it's reimagining what "conversion" means in a world where we can't track it.
2. The CDP Question
Brett Gailey dropped what might be the most important insight: "We're a CAPI & event obfuscation only shop. Our Meta rep communicated to us as not being directly impacted."
A glimmer of hope? Maybe. But it requires serious technical infrastructure - pay attention to the CDP players like those specific to healthcare such as Freshpaint or a newcomer - Ours Privacy as well as cross-industry players like Segment.
3. The Compliance Paradox
Yulie Klerman, who built LiveRamp's healthcare vertical, reminded us of an uncomfortable truth: Even if you find technical workarounds, you're swimming in increasingly regulated waters.
”It's not just Meta's rules," she warned. "It's state privacy regulations, HIPAA, and public perception."
4. The Size Split
Large healthcare companies will play it safe. But as Chris Turitzin noted: "Small startups... I don't think they have that same risk."
Different companies, different risk tolerances, different approaches. Startups are going to play fast and loose with these rules cause they are under a different reality than layer players. This is known risk (this has always been true) but pay attention to when these startups grow. Do they keep the same bad habits?
The Health & Wellness Gray Zone
Here's a fun riddle: When is a health company not a health company? According to Meta... it's complicated.
The definition of "health and wellness" feels like one of those Supreme Court obscenity cases - they know it when they see it. But for those of us building products and measuring campaigns, we need something more concrete.
From the roundtable discussion, here's what we know right now:
Meta defines health & wellness as properties "associated with medical conditions, specific health statuses, or provider/patient relationships." Think patient portals, wellness trackers for specific conditions, or anything tracking health outcomes.
But here's where it gets messy:
- A fitness app? Probably fine.
- A depression tracking app? Restricted.
- A vitamin company? Depends on the claims.
- A healthcare scheduling platform? Welcome to the gray zone.
As one Meta rep told a roundtable participant: "Most health supplement brands will not be affected, unless it is a prescription or for a specific disease." But another participant's supplement brand got flagged. Classic.
The secret seems to lie in condition specificity. The more condition-specific your product or marketing, the more likely you'll face restrictions. Likely more to come here but a lot of unanswered questions at the moment.
The CDP Plot Twist
Here's the fascinating thing about constraints/regulation in healthcare tech: they often create new winners.
When Apple killed mobile tracking, Mobile Measurement Partners (MMPs) became essential overnight. When GDPR hit, consent management platforms had their moment.
Now? It might be the CDP's (Customer Data Platform) time to really shine. Being a middleman and a way for advertisers to offload liability could be a goldrush for the best positioned players.
But not just any CDP. Healthcare needs something different than most other industries. As I learned at Revive tracking multi-touch attribution across health systems - you need infrastructure that understands both technical compliance and healthcare's unique dynamics.
What Makes Healthcare CDPs Different
Think about your typical CDP. It's built for e-commerce, B2B SaaS, maybe fintech. But healthcare? That's a different beast entirely:
Event Hygiene
- Regular CDP: "Track everything, figure it out later"
- Healthcare CDP: "Track precisely what matters, with clear governance"
Identity Resolution
- Regular CDP: "More data = better matching"
- Healthcare CDP: "Clean data = compliant matching"
Activation Workflows
- Regular CDP: "Push to all channels"
- Healthcare CDP: "Push with purpose and protection - likely with a confirmation step“
The New Technical Stack
Based on the roundtable discussion, here's what the winning stack might look like:
Foundation Layer
- HIPAA-compliant CDP (like Ours Privacy or Freshpaint)
- Event obfuscation engine
- URL redaction system
Processing Layer
- Custom conversion definitions
- Privacy-safe identity resolution
- Compliant activation rules
Activation Layer
- Meta CAPI integration
- Cross-channel orchestration
- Compliance monitoring
As Brett Gailey noted in the roundtable, teams using this kind of setup might be insulated from Meta's changes. But - and this is crucial - only if implemented thoughtfully. More importantly - no one really knows yet and its unclear if Meta is even sure.
The Data Product Manager's Dilemma
If you're a data product manager in healthtech, you're probably asking:
- "Do we build this in-house?"
- "Which CDP vendors truly understand healthcare?"
- "How do we maintain performance while increasing privacy?"
The answer? It depends on your scale. But here's what I learned measuring campaigns at Revive: sometimes the most elegant solution is the most boring one. It’s ok if its complex (that’s reality) but don’t settle for complicated.
Start simple:
- Map your conversion events
- Document your privacy requirements
- Build clean activation workflows
- Test and iterate with compliance in mind
The Path Forward for Data and Product Leaders
If you're leading data, analytics, or product at a healthcare company, here's your playbook:
Rethink Measurement
- Build proxy metrics that don't rely on direct conversion tracking
- Get creative with engagement signals
- Focus on top-of-funnel indicators that correlate with intent
The reality is you never truly had ROAS down - don’t kid yourself.
As John Wanamaker famously said:
Half the money I spend on advertising is wasted; the trouble is I don't know which half
Every function (even accounting + finance) deals in assumptions and abfuscations - marketing and product simply have more unknowns. Accept it and figure out how to move forward.
Strengthen First-Party Data
- Double down on owned channels
- Build better internal attribution models
- Create measurement frameworks that don't depend on platform data
Use this as an impetus to shift from the buy side over to the build side. Get a better handle on your own data and tooling while investing in owned channels. Don’t over-rotate but don’t be completely dependent on a company like Meta - they don’t care about you or your patients.
Explore Alternative Channels
- Test channels where healthcare isn't as restricted (but be careful!)
- Build cross-channel attribution models
- Focus on content engagement metrics
When I helped instrument campaigns at Revive, we discovered something counterintuitive: restrictions often revealed better channels we'd ignored. Some thoughts:
- Reddit: Shockingly good for healthcare discussions. Their ad platform is like Meta circa 2015 - less sophisticated but more permissive. Just watch the compliance as it’s easy to get in trouble here.
- Programmatic Healthcare Networks: Yes, they're expensive. Yes, they're old school. But they understand healthcare compliance better than any social platform.
- TikTok: Before you roll your eyes - their healthcare policies are still evolving. This is both an opportunity and a risk.
- Point-of-Care Networks: Remember these? They're having a renaissance moment.
- LinkedIn: Especially for B2B healthcare. They're the tortoise in this race - slow, steady, and surprisingly stable on privacy.
The secret? Build your measurement framework first, then pick your channels. Not the other way around.
The Bigger Picture
This feels like a tipping point. But maybe that's good.
Healthcare data has always lived in a world of constraints. HIPAA wasn't the end of healthcare marketing. Neither was the HITECH Act. Or state privacy laws.
Each time, we adapted. We got better and hopefully did better by our patients. We built smarter systems and maybe this pushes folks to go back to the basics - build a product or service that produces value for patients and a business that supports it sustainably.
What Happens Next
For data and product leaders, the next few months are crucial. The situation is going to change and hopefully, Meta will give folks more clarity ( to say nothing of the uncertainty on what brands
Ask yourself:
- How can we measure success without relying on platform data?
- What does "good" attribution look like in a privacy-first world?
- How do we balance growth with increasing privacy demands?
The answers might surprise you. They usually do.
Because sometimes the best innovations come from constraints.
And healthcare data products? We've been innovating around constraints since day one.
10 Uncommonly Useful Observations on Product-Market Fit for Data Products
Forget what you know about product-market fit for traditional SaaS—data products play by a different rulebook. In this post, I share ten uncommonly useful observations from my years in the healthcare data trenches, challenging conventional wisdom and providing a roadmap for success in the complex wo
As a veteran in the healthcare data product space, I've seen my fair share of successes and failures when it comes to achieving product-market fit. While many principles from traditional SaaS products apply, data products have their own unique challenges and opportunities. Here are ten uncommonly useful observations that can help you navigate the complex landscape of product-market fit for data products.
1. The "Aha!" moment is often delayed
Standard SaaS expectation: Users should have an immediate "Aha!" moment upon first use.
Data product reality: The true value of a data product often emerges over time as patterns and insights accumulate. Your onboarding process needs to set the right expectations and provide early wins while building towards the bigger picture.

2. Your product is only as good as your data sources
Standard SaaS expectation: Product quality is primarily determined by features and user experience.
Data product reality: The quality, freshness, and relevance of your data sources can make or break your product. Invest heavily in data acquisition, cleansing, and integration. Remember, garbage in, garbage out.

3. Customization is not just a feature, it's a necessity
Standard SaaS expectation: One-size-fits-all solutions with minor customization options.
Data product reality: Every organization's data landscape is unique. Your product needs to be flexible enough to accommodate diverse data structures, integration points, and use cases without becoming overly complex.
4. The sales cycle involves education and change management
Standard SaaS expectation: Demonstrate value quickly and close the deal.
Data product reality: Selling a data product often requires educating prospects on data literacy, changing existing processes, and aligning multiple stakeholders. Your sales process should include elements of consultative selling and change management.
5. Success metrics are often indirect
Standard SaaS expectation: Direct metrics like user engagement and feature adoption indicate success.
Data product reality: The true impact of your data product might be several steps removed from direct usage. Success could manifest as better decision-making, cost savings, or revenue growth for your clients. Develop ways to track and attribute these indirect benefits.

6. The "network effect" is data-driven
Standard SaaS expectation: More users lead to more value through increased interactions.
Data product reality: More data often leads to better insights and predictions. Consider how you can create virtuous cycles where using your product generates more valuable data, which in turn makes the product more valuable for all users.
7. Regulatory compliance is a feature, not a bug
Standard SaaS expectation: Compliance is a necessary evil.
Data product reality: In regulated industries like healthcare, robust compliance features can be a major selling point. Embrace compliance as a core feature and competitive advantage, not just a checkbox.

8. The product evolves with the data science field
Standard SaaS expectation: Periodic feature updates based on user feedback and market trends.
Data product reality: Advances in data science and machine learning can fundamentally change what's possible with your product. Stay on the cutting edge and be prepared to make significant pivots as new techniques emerge.
9. User personas include both humans and algorithms
Standard SaaS expectation: Focus primarily on human end-users.
Data product reality: Your product might need to serve both human analysts and automated systems or AI models. Design your APIs and data outputs with both in mind.

10. The MVP is more complex but potentially more powerful
Standard SaaS expectation: Build a simple MVP to test core assumptions quickly.
Data product reality: Your MVP needs to include not just basic features, but also data pipelines, quality checks, and initial models or analyses. While this makes the MVP more complex, it also means you're testing a more complete value proposition from the start.
Conclusion
Achieving product-market fit for data products requires a nuanced understanding of the unique challenges and opportunities in this space. By keeping these observations in mind, you can avoid common pitfalls and focus on the elements that truly drive value for your users.
Remember, in the world of data products, your goal isn't just to fit the market — it's to evolve with it, shape it, and ultimately, to help your users make better decisions through the power of data.
A New Approach for Complex Environments:
As a young business analyst, I started my first contract in a warehouse and operations plant. A hundreds of years old manufacturer that had no ERP (enterprise reporting platform) or inventory tracking yet was wildly profitable for decades (their products were sold in cans but not those you are thinking).
Me and a small team were tasked with onboarding an inventory tracking system in this old-school environment. After weeks of prep and training, we were on-site for dozens of shifts as we handed out barcodes and scanners to employees.
We noticed something off on the third day.
Inventory levels kept ticking down. Throughput was constrained and manual adjustments increased. We thought the sync was delayed for the first day, the barcodes were placed incorrectly, or the scanners were failing.
Then I kept walking the floor. In the packing room, I noticed scanners were sitting on benches and their chargers - not good.
I approached Lenny (floor manager) and pointed this out to him.
,
“Out of sight, out of mind son” he replied.
I took a step back that evening and wondered about this problem.
Then, we bought holsters for each floor employee and let them customize their scanners.
Inventory levels went back to expected in a week. Problem solved for a couple hundred dollars.

In the ever-evolving fields of data and product development, especially in healthcare, we need strategies that break free from conventional boundaries. Not everything works when everything is meant to be a system in itself.
A first principle is a “basic, foundational proposition or assumption that cannot be deduced from any other proposition or assumption.”. This philosophical approach encourages us to strip problems to their fundamental truths, which is crucial for teams dealing with complex data and product challenges.
4 core aspects of data product management and first principles:
- Breakdown the problem into core components - question every requirement
- Create a data product strategy that accomplishes the mission - the intersection of customer and business value
- Build a reliable data pipeline - product thinking to process
- Win through others - be a coach
First Principles for Data Product Teams
1. Breakdown the Problem into Core Components - Question Every Requirement
First principles thinking in data product management starts with deconstructing complex problems into their fundamental elements.
Understanding the analytical (really the business) question - the so what or why - is critical.
Complexity is not the goal in and of itself. No one gets points for difficulty in business. Question every requirement. Break down every component into its parts.
Encouraging yourself and others to question the assumptions you have is critical. Think of an EHR. EHRs, at their core, are financial and billing tools and those with poor usability have been connected with more medical errors. On top of that, the average ER doc has to make 4,000 clicks in a single shift.
Does this have to be true? Why are all of these needed? Start with each factor of how something came to be and you are on the right track.
2. Create a Data Product Strategy that Accomplishes the Mission - The Intersection of Customer and Business Value
A successful data product strategy aligns with both customer needs and business goals. All employees should be focused on fulfilling the company's mission to profit or purpose, maybe both.
Most team members are working directly toward the business goal by a product or service to customers: building (engineers, data, and designers), go-to-market (marketing and sales), optimizing the business (analysts and resourcing), or helping customs (support).
Product management doesn't directly build or operate. The goal is to inform the operations to optimize the intersection of business and customer value. How does that get done? By defining a strategy - specifically a data product one at that.
This includes four components:
- Goal and outcomes
If you don't know where you are going, you are already on your way
Go back to that first principle and a good data product manager will incessantly ask the hard questions in a quest of defining the mission they follow. What does the world look like for that goal or vision to be real?
Data Product Managers (DPMs) also need to know what other teams aim for. DPMs are intertwined deeply with other teams as your product is either an input or output of another. See it as insurance to make sure you are not colliding with others.
- Customers
“The customer is always right” and “customers don’t know what they want” are both accepted business wisdom. The line between “inspiringly bold” and “foolishly reckless” can be a millimeter thick and only visible with hindsight.” - Morgan Housel
That goal may be lofty and well-intentioned, but if no one pays for it or those that do are too few and far between, then what is the point? Customer input is the quantitative and qualitative data you develop and a sense you must cultivate.
What are customers signaling? Not directly, but what are they hiring to get a job done, and how are you, as a data product, helping your customers make progress in the jobs they need to get done?
That signal is worth listening to and what you hear from customers and what they do is the ultimate validation of your goal and efforts.
- Environment
Nothing is built in a vacuum. If you see an opportunity, others likely have as well.
When looking externally, think of PESTLE (Political, Economic, Social, Technological, Legal, and Environmental) - what changes affect your company, input data, and customers' interest?
While much focus is on the external factors in the environment (competitors and market forces), you should never discount the company environment and dynamics. Most importantly with this, understand the cyclical nature of teams and focus - everything is always in a state of change, whether you choose to see it or not.
Calm plants the seeds of chaos.
- Constraints
Lastly, any product team needs to understand the limits of the team that is doing the building. Just as a captain must understand the crew, time, and fuel to make a journey successful, DPMs will also.
People are the biggest constraint for product teams but the second most important constraint for data product teams.
Data, as mentioned, and its myriad components are the largest constraint on a data product once the goals, customers, and environment are better understood.
- Is the quality appropriate?
- Is there governance, documentation, and observability?
- What are the biases and limitations?
- How stable and extensible is the data?
Money is a critical factor in determining the scope and scale of a data product. The budget allocated dictates the quality and quantity of resources that can be employed, including technology, tools, and personnel. These constraints require a balancing act between desired features and cost implications.
Acquiring new data sources, spending on third-party tools, investing in data engineering, or freeing up resources for GTM (go-to-market) is critical to determining a trajectory.
Just like any other product, you can't consider only the initial development but also the maintenance and updates. Scaling, enhancements, quality systems, ETL updates, and product adaptation to changing needs.
Time constraints impact the speed at which a data product can be brought to market. A limited timeline might necessitate compromises in product features or depth of data analysis.
In fast-evolving industries, especially in this age of generative AI, where everything seems to change by the minute, time is crucial to ensure the data product remains relevant and competitive. Delays in development can result in missed opportunities or outdated solutions by the time of launch.
Thanks for joining - see you next time!
Part 2 - Next time principles 3 + 4
- Build a Reliable Data Pipeline
- Win Through Others
Where to learn more
Recommend books, articles, and other resources for readers to deepen their understanding of First Principles Thinking.
- “The Great Mental Models” by Shane Parrish for versatile thinking frameworks.
- "Inspired" by Marty Cagan for his influential text in developing product thinking.
- "Same as Ever" by Morgan Housel for a broad psychological look at the things through history that never change.
10 Key Elements for Creating Successful Data Products: Data Product Anatomy
Master the art of data product creation with 10 key elements: Adaptable, Specialized, Discoverable & more! 🚀🌟
🚀 Greetings, data enthusiasts! Kevin here, and today we're going to delve into the fascinating world of data products. In this age of information, data is an invaluable asset, and effectively utilizing it can set your organization apart from the competition.
So, let's dive right in and examine the essential components for creating successful data products that not only achieve your business objectives but also engage your users. Without further ado, let's embark on a journey to explore the anatomy of data products and the 10 key elements that will help you understand and build impactful data products
🤔 Data Product vs. Data As A Product: What's the Difference?
🧬 Data Product
A data product is any technological product or element that relies on data to achieve its primary purpose. Think of it as a tool that uses data to solve problems and provide insights.
📱 Data As A Product
Now, "data as a product" is when you treat data itself as a valuable commodity. It's like transforming data into a shiny new gadget that your customers (or internal team members) want to get their hands on. This approach helps democratize data by making it more accessible, usable, and valuable to everyone in the organization.
👉 Remember: a "data product" uses data to achieve its goal, while "data as a product" means data is the actual product being offered. Data as a product is a subset of a data product. Applying product thinking to data management.
Now that we've got that cleared up, let's move on to the main event!
🧬 10 Key Elements of Data Products
1. Adaptable 🌿
To create a successful data product, it should be adaptable and seamlessly integrate with various inputs and outputs. It should effortlessly expand to accommodate new data sources and adapt to changing user needs. For instance, a data product should have the ability to connect with different databases and platforms, ensuring its usability across multiple systems.
2. Discoverable 🔍
Make your data product easily found and accessible without being hidden or restricted. Users should be able to locate it quickly and understand how it can benefit them. This includes having clear documentation, intuitive navigation, and easy-to-understand metadata.
3. Specialized 🎯
A successful data product must address a focused set of valuable problems for external customers. By having a clear purpose, the product can be designed to effectively solve these specific problems. This ensures that the data product remains relevant, efficient, and valuable to its users.
4. Fortified 🏰
Security and stability are crucial for any data product. Your product should ensure reliable data handling and protect sensitive information. This includes having strong access controls, data governance rules, and thorough testing to ensure data integrity and security are enforced.
5. Contextual 📚
A successful data product should maintain a historical record of its purpose and problem-solving context, including a data dictionary and external references. This helps users understand the data product's history and evolution, making it easier for them to trust and use it effectively.
6. Engaging 🎉
To capture the interest of your target audience, your data product should provide relevant and valuable insights. This can be achieved through interactive visualizations, easy-to-understand reports, and personalized recommendations. By making your data product engaging, you'll encourage users to interact with it more frequently and derive greater value from it.
7. Loveable 💖
A successful data product should exceed the minimum loveable product standard, making it approachable and user-friendly. This means prioritizing usability, design, and overall user experience. By creating a product that users enjoy using, you'll increase adoption and drive success.
8. Scalable 📈
A successful data product should be designed with scalability in mind. As your user base grows or your data volume increases, your data product should be able to handle the increased workload without compromising performance or functionality. This includes considering the infrastructure, data processing, and storage requirements needed to support your data product in the long term.
9. Actionable 💡
Your data product should provide insights that drive decision-making and enable users to take action based on the information it provides. The key is to present data in a way that helps users make informed decisions, whether that's through clear visualizations, relevant metrics, or user-friendly interfaces. By making your data product actionable, you'll empower your users to leverage the insights it provides effectively.
10. Collaborative 🤝
A successful data product should promote collaboration among its users, encouraging them to share insights, discuss findings, and work together towards common goals. This can be achieved by integrating features such as comments, annotations, or sharing options within the data product. By fostering a collaborative environment, your data product will become a valuable tool that helps your users work together more effectively.
🌟 Real-life Data Product Examples
🎬 Netflix: Adaptable, Engaging, and Loveable
Netflix has transformed the way we consume entertainment with its data-driven recommendation engine. By analyzing user preferences and viewing history, Netflix provides personalized content suggestions to keep users engaged. The platform seamlessly adapts to new data inputs, such as user behavior, content availability, and device usage, to enhance its recommendations. Netflix's engaging user interface and easy-to-use features make it a loveable data product that keeps users coming back for more.

🧠 Einstein AI (Salesforce): Specialized, Fortified, and Contextual
Einstein AI is Salesforce's artificial intelligence solution that offers specialized data products tailored to various industries and use cases. By leveraging machine learning algorithms and natural language processing, Einstein AI enables organizations to automate processes, gain insights, and make data-driven decisions. The platform is fortified with robust security features, ensuring data protection and compliance. Additionally, Einstein AI maintains context by integrating with Salesforce's extensive ecosystem, allowing users to seamlessly access relevant data and insights.

🏠 Airbnb: Adaptable, Fortified, and Loveable
Airbnb revolutionized the short-term rental market with its data-driven dynamic pricing algorithm. This data product helps hosts optimize their rental prices based on factors such as location, demand, and seasonality. The algorithm continuously adapts to market conditions and user preferences, providing accurate pricing suggestions to maximize revenue for hosts. Airbnb prioritizes data security to protect user information and offers a loveable, user-friendly interface that appeals to both hosts and guests.

Conclusion 🚀
Creating successful data products requires a deep understanding of the product's anatomy and how it fits within your organization's ecosystem. By considering the key factors discussed above, you'll be well on your way to developing data products that not only achieve your business objectives but also delight your users. Remember, successful data products are adaptable, specialized, discoverable, fortified, contextual, engaging, loveable, scalable, actionable, and collaborative! Good luck! 🌟
The Terrible Stroad: Road of Compromises
The post advocates for purpose-built and opinionated data products, akin to well-designed streets or roads. To avoid becoming a "stroad", the author suggests defining a clear purpose, saying no to feature creep, prioritizing the user experience, and iterating and improving.
You’ve seen them if you’ve spent any time in North America. You likely didn’t know their names.
I sure didn’t.
Not until I watched this video from Not Just Bikes on YouTube.
If you don’t have the time, don’t worry. I’ll summarize:
🚙 Stroads are a street/road hybrid that are dangerous and ineffective.
🚶♀️ Stroads are hostile to non-car users and make walking or cycling uncomfortable and dangerous.
💸 Stroads are expensive to maintain and do not provide good value for the space they take up.
🌳 Stroads are ugly and uninviting due to the removal of trees in their clear zone.
🏢 Stroads do not support a sense of community or encourage people to stay and spend time.
NJB pulled from a fantastic word from Strong Towns – the “Stroad”.
"Stroad" is a word we coined in 2013 to explain those dangerous, multi-laned thoroughfares you encounter in nearly every city, town, and suburb in America. They're what happens when a street (a place where people interact with businesses and residences, and where wealth is produced) gets combined with a road (a high-speed route between productive places).
They are enormously expensive to build and, ultimately, financially unproductive. They're also very dangerous.
Stroads are a compromise – in the worst sense. They are an attempt to have the best of both – interaction vs. transit – without the courage to recognize that these are opposing purposes.
The Compromise Conundrum
Just as the stroad attempts to straddle the line between street and road, data products can fall victim to the same compromise conundrum. When we try to create a product that caters to everyone's needs and desires, we end up with an unwieldy, unfocused mess.
A dashboard that attempts to solve everything. A table meant to summarize and store. An API meant to convey differing levels of granularity.

Instead of producing a data product that's flexible and nimble, we end up with a stroad-like monstrosity, a hodgepodge of features and functionality that's neither efficient nor effective. And just like the stroad, this kind of data product is expensive to build, difficult to maintain, and frustrating to use.
Think of it as a zoom level on a map. The difference between a globe and a topographic map. Both opinionated. Both useful. Yet meant for different purposes. When navigating treacherous terrain, a globe does nothing to forge a safe path ahead. When flying high in the air or navigating oceans, what good is the topography of a trail?
Opinionated Data Products
It's time for data products to take a stand. Rather than striving to be all things to all people, data products should be opinionated. An opinionated data product knows what it wants to achieve and isn't afraid to make bold choices in pursuit of its goals.
An opinionated data product might make some users unhappy by not catering to their every whim. However, by focusing on a clear, specific goal, it provides a better experience for its core audience. Instead of trying to be a stroad that pleases no one, an opinionated data product can be a well-designed street or road that serves its purpose with aplomb.
“When you try to be everything to everyone, you accomplish being nothing to anyone” - Bonnie Gillespie
Anatomy of a Data Product
That leaves us still with the need for structure. You can’t refine a product without first understanding it’s components. Let’s revisit a definition
A data product is a collection of data that is designed to meet the specific needs of a user base, providing a range of interfaces through which users can interact with it. These interfaces may include software, visualizations, direct feeds, and more. Ultimately, a data product serves to fulfill certain tasks or "jobs" that the user base requires, making it a purpose-built solution for meeting specific data-related needs.
The components of a data product should be as follows and give us the flexibility to alter each to support purpose-built solutions. A data product is:
- Adaptable: Seamlessly integrates with various inputs and outputs, and effortlessly expands to accommodate new data sources.
- Specialized: Purposefully designed to address a focused set of valuable problems for external customers.
- Discoverable: Easily found and accessible without being hidden or restricted.
- Fortified: Ensures security and stability for reliable data handling.
- Contextual: Maintains a historical record of its purpose and problem-solving context, including a data dictionary and external references.
- Engaging: Captivates the interest of its target audience through relevant and valuable insights.
- Loveable: Exceeds the minimum loveable product standard, making it approachable and user-friendly.
Embracing Purpose
So, how can you avoid the perils of the stroad when creating your next data product? Here are a few principles to guide you:
- Define a clear purpose: Before you start building your data product, make sure you know exactly what you want it to accomplish. By having a clear purpose, you'll be better able to make focused decisions that serve that goal.
- Say "no" to feature creep: It's tempting to add more and more features to your data product, but this can lead to a stroad-like morass. Stay focused on your core purpose and be willing to say "no" to features that don't align with it.
- Prioritize the user experience: Just like the stroad is an unpleasant place to be, a poorly designed data product can be a frustrating experience for users. Keep your users front and center in your design process, ensuring that your data product is easy to use and meets their needs.
- Iterate and improve: Don't be afraid to make bold choices in your data product. If something isn't working, learn from the feedback and iterate on your design. This iterative process will help you hone in on the perfect balance between form and function.
By embracing these principles and avoiding the trap of the stroad, you can create data products that are focused, efficient, and effective. Remember, it's better to be a great street or a great road than a terrible stroad.