Blog
Blog posts
The best way to look at a problem is not to view it as a problem at all but as an opportunity to grow stronger, more skilled, more confident. - John C. Maxwell
The Continuous Sprint Dilemma
Six months into leading Revive's data product team, I faced a familiar problem. Midway through our fourth consecutive two-week sprint on the Patient Journey Analyzer, team morale plummeted.
"We constantly plan but never finish," complained our data scientist. "We keep pushing the interesting modeling work to the next sprint."
"The UI keeps changing because we don't have time to explore visualization options properly," added our designer.
Our tech lead nodded silently, clearly frustrated.
These complaints weren't new. The agile sprint methodology that served our marketing products well created specific strain for our data products. The relentless cycle of planning, executing, and reviewing fragmented our work and prevented deep thinking on complex data problems.
After discovering Ryan Singer's "Shape Up" methodology from Basecamp, I proposed a shift to my team and leadership: "Let's abandon our two-week sprints and try a completely different approach for our next data product."
Six weeks later, we delivered the most polished, well-architected data product in our company's history—with an energized rather than exhausted team.
Shape Up is a framework built on the Agile Manifesto (go read it, still an absolute classic and relevant today)
Manifesto for Agile Software Development
We are uncovering better ways of developing
software by doing it and helping others do it.
Through this work we have come to value:
Individuals and interactions over processes and tools
Working software over comprehensive documentation
Customer collaboration over contract negotiation
Responding to change over following a plan
That is, while there is value in the items on
the right, we value the items on the left more.
Like Data Driven Scrum, CRISP-DM or other frameworks that focus on flexibility in probabilistic outcomes, Shape Up is a great fit for the unique challenges of data product teams.

The Unique Challenges of Data Product Development
Data product development differs fundamentally from traditional software development in several key ways:
- Data exploration involves inherent uncertainty: Unlike feature development with well-defined specifications, data work includes exploratory phases with unpredictable timelines and outcomes.
- Ethical questions require thorough deliberation: Data products, particularly those using algorithms or AI, present complex ethical challenges that demand more than rushed sprint planning discussions.
- Technical and UX decisions intertwine: Your data model directly affects what users see, creating interdependencies difficult to resolve in small time boxes.
- Specialists need uninterrupted focus: Your data scientist designing a complex feature engineering pipeline loses valuable momentum when forced to shift focus for sprint planning.
- Integration testing demands methodical verification: Ensuring proper data flow through every system layer requires comprehensive testing that rarely fits neatly into sprint boundaries.
Traditional agile frameworks - like Scrum or SAFE, with their push for short time boxes and constant planning, often hinder progress on these complex data product challenges.
Shape Up: Tailored for Data Product Teams
Shape Up offers a refreshing alternative to continuous sprint cycles, with principles that align perfectly with data product team needs:
1. Six-Week Cycles Replace Two-Week Sprints
Six-week work cycles provide data teams crucial advantages:
- Adequate data exploration time: Six weeks allows teams to properly explore datasets, test multiple modeling approaches, and implement the optimal solution.
- Space for ethical consideration: Longer cycles enable thoughtful discussion of ethical implications impossible to address in packed sprint planning sessions.
- Freedom to tackle fundamental problems: When data scientists and engineers know they have six uninterrupted weeks, they solve architectural challenges properly rather than applying temporary fixes.
As our data architect noted during our first Shape Up cycle: "I finally have permission to solve the problem correctly instead of just meeting stupid Friday deadlines."

2. Shaping Work Before Commitment Improves Outcomes
In Shape Up, teams "shape" projects before committing to a cycle—defining the problem, outlining a solution, and identifying risks and boundaries. You always need this in building products but becomes crucial in complex data products. Scrum has these ceremonies but after multiple attempts at different companies, this "double diamond" section always gets squeezed.
Steps to shaping
Shaping has four main steps that we will cover in the next four chapters.
- Set boundaries. First we figure out how much time the raw idea is worth and how to define the problem. This gives us the basic boundaries to shape into.
- Rough out the elements. Then comes the creative work of sketching a solution. We do this at a higher level of abstraction than wireframes in order to move fast and explore a wide enough range of possibilities. The output of this step is an idea that solves the problem within the appetite but without all the fine details worked out.
- Address risks and rabbit holes. Once we think we have a solution, we take a hard look at it to find holes or unanswered questions that could trip up the team. We amend the solution, cut things out of it, or specify details at certain tricky spots to prevent the team from getting stuck or wasting time.
- Write the pitch. Once we think we’ve shaped it enough to potentially bet on, we package it with a formal write-up called a
pitch. The pitch summarizes the problem, constraints, solution, rabbit holes, and limitations. The pitch goes to thebetting tablefor consideration. If the project gets chosen, the pitch can be re-used at kick-off to explain the project to the team.
Properties of Shaped work:
- Property 1: It’s rough
- "Work in the shaping stage is rough. Everyone can tell by looking at it that it’s unfinished. They can see the open spaces where their contributions will go."
- Property 2: It’s solved
- "Despite being rough and unfinished, shaped work has been thought through. All the main elements of the solution are there at the macro level and they connect together. The work isn’t specified down to individual tasks, but the overall solution is spelled out."
- Property 3: It’s bounded
- "Lastly, shaped work indicates what not to do. It tells the team where to stop. There’s a specific appetite—the amount of time the team is allowed to spend on the project. Completing the project within that fixed amount of time requires limiting the scope and leaving specific things out."

In our current role, during the two-week shaping process for our Risk Stratification Engine:
- Our data scientist identified serious data quality issues, allowing us to fix the data pipeline before committing development resources
- Our product and design leads tested multiple visualization approaches and selected one that better conveyed prediction uncertainty
- Our tech lead spotted a potential performance bottleneck in real-time scoring and designed an elegant caching solution
By the time we started the six-week cycle, we understood better what we needed to build and knew it was both valuable and feasible.
3. Betting Table Forces Strategic Resource Allocation

For data products competing for limited specialist resources, this drives crucial prioritization discussions:
- "Does this machine learning model justify six weeks of our data science team's time versus the visualization engine?"
- "Do we trust the data quality enough to bet on this project now, or should we improve it first?"
- "Is this ethical concern significant enough to address before proceeding?"
The betting table got us out of tactical backlog management to meaningful bets. Also don't worry, you will forget something. Important ideas (the ones that make or break the trajectory of a product) come back.
4. Fixed Time, Variable Scope Enables Better Decisions

Rather than creating arbitrary deadlines that force teams to compromise data quality or ethical considerations, they can:
- Deeply explore the most critical aspects of the problem
- Make deliberate scope decisions based on discoveries
- Deliver valuable solutions after six weeks, even if they differ from initial expectations
This fundamentally changes how teams measure success—from "did we complete all sprint stories?" to "did we solve the core problem effectively and responsibly?"
Shape Up in Action: A Healthcare Data Product Case Study
Here's how we applied Shape Up to develop a healthcare provider recommendation engine matching patients with specialists based on their conditions, insurance, location, and care needs for a health system - during my days at a healthcare marketing agency.
The Shaping Phase
Before committing to a six-week cycle, our Product Squad (Product Manager, Tech Lead, Design Lead, and Data Lead) shaped the work over two weeks:
- Problem Definition: We narrowed "help patients find doctors" to "match patients with specialists for their specific chronic condition based on provider expertise, location, and insurance compatibility."
- Combination of claims + de-identified patient summaries got the fields in place.
- Appetite Setting: We committed a full six-week cycle from our core team rather than fragmenting it across multiple sprints alongside other work.
- Solution Exploration: Our Data Lead tested multiple matching algorithms and recommended a hybrid approach balancing relevance with explainability.
- Fuzzy match in Alteryx + scipy augmentation if yall remember those days
- Risk Identification: We pinpointed specific risks, including provider directory data freshness issues and potential recommendation bias.
- Definitive kept us up to date
- Boundary Setting: We deliberately excluded provider quality metrics since the available data lacked reliability across specialties and regions.

The resulting pitch provided clear direction with established boundaries, guiding the team while leaving room for implementation problem-solving.
The Six-Week Cycle
With clear shape established, our cross-functional team built the recommendation engine over six uninterrupted weeks:
Weeks 1-2: The team mapped the entire solution into discrete "scopes" and tackled the highest-risk component first: the matching algorithm.
Weeks 3-4: With the core algorithm working, they integrated the provider + patient data pipeline and built the user interface for search criteria.
Weeks 5-6: They implemented the results display, refined the algorithm based on testing, and added features like saved recommendations and sharing.
Throughout, they used "hill charts" to visualize progress—tracking how components moved from "figuring it out" to "getting it done" rather than merely counting completed tasks.

The Results
At the end of six weeks, we delivered a fully functional provider recommendation engine to our client that:
- Matched patients with specialists based on their specific conditions
- Accounted for insurance compatibility (payor, plan, and overlap period) and location preferences
- Provided transparent explanations for each recommendation
- Respected HIPAA and BAA agreements
- Included filtering by service line and geo regions
We shipped a complete working product that delivered immediate value—not a prototype requiring additional sprints. The team emerged energized rather than exhausted. Our Data Lead said, "This is the first time we've had space to build something properly from the ground up."
Implementing Shape Up for Your Data Product Team
Start transforming your data product team with these five steps:
1. Begin with One Cycle
Test Shape Up with a single six-week experiment:
- Select one meaningful data product initiative
- Dedicate a cross-functional team for six weeks
- Protect them from other responsibilities during this period
- Evaluate results before expanding the approach

2. Adapt Shaping for Data Products
When shaping data product work, focus on:
- Data quality verification: Confirm necessary data is accessible and reliable before committing
- Ethical boundary setting: Address potential biases, privacy concerns, and governance requirements explicitly
- Technical feasibility testing: Run proof-of-concepts on complex algorithms or data pipelines
- Visualization prototyping: Test how users understand complex data through different presentation methods
3. Build a Complete Data Product Squad:
Assemble that product squad and learn more about it here! Beyond the Product Trio - Why Data Products Need a Squad
- A Product Manager with data product expertise
- A Tech Lead focused on data architecture and performance
- A Design Lead skilled in data visualization
- A Data Lead with data science, engineering, and ethics knowledge
- If vertical or regulated, you might need a SME such as a clinical lead for healthcare or lawyer for lawtech

4. Use Hill Charts for Visibility
Adopt hill charts to visualize data product progress:
- The uphill phase shows data exploration, model design, and approach development
- The downhill phase represents implementing the chosen solution
- Moving components "over the hill" indicates resolved uncertainty
This gives stakeholders meaningful progress visibility without demanding arbitrary completion percentages that make little sense for exploratory data work.
5. Create Breathing Room Between Cycles
Take two weeks after each six-week cycle to:
- Refine data pipelines needing attention
- Address minor issues discovered during the cycle
- Explore approaches for the next cycle
- Deliberately select your next highest-value initiative
This "cool-down" period prevents teams from rushing into new work without reflection. Easiest way to burn team out and go off the rails is to string poorly shaped work back to back. give folks a break

The Questions Worth Asking
As you consider applying Shape Up to your data product team, reflect on these thought-provoking questions:
- How might longer, uninterrupted cycles change the ethical considerations in your data product development?
- Could the shaping process help identify data quality issues earlier in your workflow?
- What would happen if your data scientists could explore multiple approaches without daily standup pressure?
- How would your data visualization strategy change if designers had more time to experiment before committing?
- What organizational resistance might you encounter, and how will you address it?
Beyond the Sprint Treadmill
Data product development demands space for exploration, ethical consideration, and deep technical work that doesn't fit into two-week sprints.
Shape Up respects the unique challenges of data work while maintaining the discipline required to ship products.

For my team, adopting Shape Up shifted our entire mindset—from constant planning to thoughtful shaping and focused execution. For a few of my teams, it resulted in better data products, happier team members, and more strategic decisions about what we build and why.
If your data product team suffers from sprint fatigue, cuts ethical corners due to time pressure, or accumulates technical debt because there's "never time to do it right," Shape Up offers a way out. It's the ideal of the Agile Manifesto in my opinion
In data products, sometimes you move faster by slowing down—taking time to shape work properly, commit appropriate resources, and give your team space to build something truly valuable.
I'd love to hear your thoughts!
Have you tried alternative methodologies for data product development? What challenges have you faced with traditional agile approaches?
References
A product manager recently shared their breakthrough on LinkedIn after completing Shreya Shankar & Hamel Husain's AI Evaluation course:
"Been hunting for repeatable frameworks for building AI products as a PM. The problem: AI products are non-deterministic by nature. Manual testing doesn't scale. I was hunting for a systematic way to catch issues before users do."
They felt "completely out of my depth surrounded by data scientists and engineers" but walked away with game-changing frameworks: the Three Gulfs framework for diagnosing AI failures, the Analyze-Measure-Improve cycle, and LLM-as-Judge setup. Their conclusion:
"As AI becomes core to our products, we can't just 'manage around' the complexity anymore."
This perfectly captures the challenge every data product manager faces today. Six months into rolling out our first AI-powered NLP annotating support tool, our VP clinical data pulled me aside: "How do we know that this isn't going to hallucinate?" Our data quality was perfect—99.7% completeness, zero schema violations, 94.2% statistical accuracy. But he wasn't asking about data quality. She was asking whether our AI was actually helping researchers understand evidence, not just flag instances.
That conversation led me down the same rabbit hole that PM discovered. Traditional QA/QC processes weren't designed for genAI outputs. They were built for structured data, predictable patterns, and binary pass/fail scenarios. But AI outputs are probabilistic, contextual, and often subjective. They require an entirely different approach: evals (evaluations).

The $3M Reality Check: Why Perfect Data ≠ Perfect AI
Let me paint you a picture of what happens when you rely on traditional QA for AI products. A friend's team built an LLM-powered analytics assistant with 97% accuracy on their test set. Perfect data quality scores. Flawless demos. Three weeks after launch, customer complaints flooded in—the AI was hallucinating metrics and confidently presenting fiction as fact to C-suite executives making million-dollar decisions.
Here's what I've learned: Data quality and AI quality are not the same thing. You can have perfect data and terrible AI outputs. You can have messy data and surprisingly good AI performance. The relationship isn't linear, and traditional QA/QC tools don't capture this complexity.
Why Traditional QA/QC Fails for AI
This gap becomes a critical business issue across industries. I learned this the hard way when our medication dosage prediction model started recommending technically correct but clinically dangerous combinations. But it's not just healthcare—I've seen similar failures in customer segmentation AI that grouped users in ways that made statistical sense but zero business sense (marketing winter coats to customers in Miami because they'd bought scarves as gifts).
Our traditional QA/QC caught zero of these issues because:
- The data was clean (passed all validation rules)
- The model was accurate (95% precision on test data)
- The outputs were consistent (same inputs produced same outputs)
But the model hadn't been evaluated for real-world scenarios. It didn't understand context, business logic, or the subtle factors that make a "correct" recommendation valuable or dangerous.
That's when I realized we needed evals.
What Are Evals? The Bridge Between Technical Accuracy and Real-World Value
Evals (evaluations) are systematic assessments of AI model performance that go beyond technical accuracy to measure real-world value and safety.
After years of building data products, I've learned that evals are the hidden lever behind every successful AI system. While data product managers obsess over data quality metrics and model accuracy, evals quietly determine whether your AI will thrive in production or become a cautionary tale. They are the Hot Topic (pun intended?) in the PM space as folks are figuring out how to build workflows that use genai models.
Think of evals as driving tests for AI systems. Traditional QA/QC asks:
- Is the data complete? ✓
- Does it match the schema? ✓
- Are the calculations correct? ✓
- Is the pipeline running? ✓
Evals ask the questions that actually matter:
- Is the AI telling the truth or making things up?
- Would a human expert agree with this recommendation?
- Is this output helpful or harmful in the real world?
- Are we treating all user segments fairly?
- Can users understand and trust the AI's reasoning?
Just as you'd never let someone drive without passing their driving test, you shouldn't let AI make critical recommendations without passing rigorous evaluations. The difference is that when AI fails, it's not just a technical glitch—it's a potential business + ethical disaster.
The Core Eval Categories That Matter
Based on implementing evals across multiple data products, there are four critical evaluation categories that separate successful AI systems from failures:
1. Safety Evals: Does the AI output pose any risk? Example: Our drug interaction checker needed to identify dangerous combinations while avoiding false alarms that would reduce trust.
2. Relevance Evals: Are the AI outputs appropriate for the specific context? Example: Our diagnostic assistant needed to suggest relevant conditions based on patient symptoms, not just statistically probable ones.
3. Fairness Evals: Does the AI treat different user populations equitably? Example: Our readmission risk model needed to predict risk accurately across demographic groups without perpetuating disparities.
4. Explainability Evals: Can users understand and trust the AI's reasoning? Example: Our treatment recommendation engine needed to provide explanations that doctors could validate and communicate to patients.
Successful evals combine three approaches: human expert review (expensive but accurate), code-based validation (fast but limited), and AI-based evaluation (scalable but needs careful setup).
The Four-Part Eval Formula That Actually Works
After burning myself repeatedly on bad evals, I've discovered that every effective eval contains exactly four components. Miss any of these, and you're back to crossing your fingers:
1. Setting the Role: Tell your evaluator exactly who they are and what expertise they bring
- Bad: "Evaluate this output"
- Good: "You are a senior data analyst with 10 years of experience in financial services evaluating ETL pipeline outputs"
2. Providing Context: Give the actual scenario, data, and constraints
- Bad: "Check if this is correct"
- Good: "Given this sales data from Q3, source system constraints, and the requirement for hourly updates..."
3. Stating the Goal: Define what success looks like in clear, measurable terms
- Bad: "Make sure it's good"
- Good: "Verify that aggregations are mathematically correct, business logic is properly applied, and no PII is exposed"
4. Defining Terminology: Eliminate ambiguity in your evaluation criteria
- Bad: "Check for quality"
- Good: "'High quality' means: accurate to source data, formatted for executive consumption, with clear data lineage"
Here's a real example that works:
**Role**: You are a data quality engineer evaluating automated insight generation.

**Context**:
- User Query: "Show me customer churn trends"
- Data Available: 24 months of customer data, transaction history
- AI Response: "Churn increased 47% in Q3, primarily driven by pricing changes"

**Goal**: Determine if the AI insight is:
1. Factually accurate based on the data
2. Statistically sound (not cherry-picking)
3. Actionable for business users
4. Free from hallucinations

**Terminology**:
- "Factually accurate": Numbers match source data calculations
- "Hallucination": Any claim not directly supported by provided data
- "Actionable": Includes enough context for business decisions
This structured approach helps ensure your AI evaluations capture the nuanced reasoning that traditional QA/QC misses entirely.
Your 30-Day Eval Transformation Plan
I've helped twelve teams implement evals. The ones who succeeded all followed this pattern:
Week 1: Foundation
- Audit your last 20 AI failures and categorize by type
- Write simple evals for your top 3 failure modes (regex, rule-based)
- Add evals to your deployment pipeline with basic alerting
Week 2: Scale
- Export 100 production examples and get 5 people to label them
- Write your first LLM-as-judge eval (aim for 85%+ agreement with humans)
- Connect evals to your CI/CD and data quality dashboard
Week 3-4: Production
- Eval 10% of production traffic and compare with user feedback
- Build eval→fix→measure workflow
- Optimize slow evals and plan your next expansion
Connecting Evals to Your Data Stack (Without Starting from Scratch)
Here's the beautiful thing: as a data PM, you already have 80% of what you need for great evals. You just need to connect the pieces differently.
Your Secret Weapons Already in Place
1. Your Data Pipeline = Your Eval Pipeline
Remember that Airflow DAG you use for ETL? Add eval steps:
# Your existing pipeline
extract_data >> transform_data >> load_to_warehouse

# Becomes
extract_data >> transform_data >> run_evals >> load_to_warehouse
                                      ↓
                              [fail] >> alert_team
2. Your BI Tools = Your Eval Dashboards
Stop building custom eval dashboards. We wasted three weeks on a fancy React dashboard before realizing Metabase worked perfectly:
- Connected eval results table to Metabase
- Built standard metrics dashboards
- Set up alerts on metric degradation
3. Your Data Quality Tools = Your Eval Framework
Great Expectations, dbt tests, Datafold—whatever you're using for data quality can power your evals:
-- dbt test that became our most valuable eval
-- tests/assert_no_hallucinated_metrics.sql
SELECT
    ai_output.metric_name,
    ai_output.metric_value
FROM {{ ref('ai_generated_insights') }} ai_output
LEFT JOIN {{ ref('actual_metrics') }} actual
    ON ai_output.metric_name = actual.metric_name
WHERE actual.metric_name IS NULL
This simple test caught our AI inventing metrics that sounded plausible but didn't exist.
Case Study: How Evals Saved Our Data Pipeline
We built an AI that monitored data pipelines with 94% accuracy. The problem? It kept telling engineers to "check the server logs" for every issue. Technically correct, completely useless.
Traditional QA: Response time ✓, Format compliance ✓, Error rate ✓
User satisfaction: "This is worthless"
Our Eval: Measured whether diagnoses actually helped engineers fix issues—identifying root causes, providing specific next steps, and estimating fix time.
Results: 67% of responses were useless "check the logs" variations. After fixing based on eval feedback: 78% now include specific root causes, 89% provide actionable next steps, and engineer satisfaction jumped from 3.2/10 to 8.7/10.
Key Learning: Your evals should measure what users care about, not what's easy to measure.
Key Learning: Evals Are About User Trust, Not Technical Validation
After a year of implementing AI evaluations, here's what I wish I'd understood from the beginning: Evals aren't primarily a technical challenge—they're a user trust-building exercise.
The goal isn't to achieve perfect scores on evaluation metrics. The goal is to build enough confidence in your AI that users will actually rely on it to make better decisions.
The Trust Equation:
- Technical accuracy gets you to the table
- Business relevance gets you adopted
- Safety evaluations keep you there
- Explainability evaluations build long-term trust
Instead of asking: "How accurate is our model?"
Ask: "Do users trust this AI enough to act on its recommendations?"
Instead of asking: "What's our F1 score?"
Ask: "Are business outcomes improving when users engage with our AI?"
The most successful AI implementations focus relentlessly on user trust metrics rather than pure technical performance.
Your Next Steps: Start Your First Eval This Week
This Week:
- Pick your highest-risk AI output
- Interview 3 stakeholders about their biggest AI concerns
- Collect 20 examples where users accepted/rejected AI recommendations
Next Week:
- Write your first eval using the 4-part framework
- Test it against your examples (aim for 90% agreement with experts)
- Set up basic monitoring
Week 3-4:
- Deploy automated evaluation on live data
- Create a simple dashboard for stakeholders
- Plan your next evaluation category
The Tools That Actually Work (links and refs below)
Start with these:
- Phoenix by Arize: Free, works out of the box
- Evidently AI: Great for data drift + eval monitoring
- Your existing data tools: dbt, Airflow, Great Expectations
If you have budget:
- LangSmith: Incredible for debugging LLM apps
- Weights & Biases: If you need experiment tracking too
Avoid: Building your own eval framework from scratch, over-engineered solutions, or anything that requires changing your entire workflow.
The Bottom Line
Traditional QA/QC got us this far, but it's not enough for AI-powered data products. The stakes are too high, the outputs too complex, and the trust requirements too demanding.
Evals bridge the gap between technical accuracy and business value. They help you answer the questions that matter: Is this AI actually helping? Can we trust it? Will users adopt it?
If you're not evaluating your AI outputs beyond technical metrics, you're not managing risk, you're managing luck. And in business, luck isn't a strategy.
Key Takeaways
- Traditional QA/QC is necessary but not sufficient for AI-powered data products
- Evals are about trust-building, not just technical validation
- Start with user concerns, not technical metrics
- Safety, relevance, fairness, and explainability are the core eval categories
- Implementation should be gradual: 30/60/90-day transformation plan
- Use your existing data stack as your eval foundation
- Success is measured by user adoption, not technical scores
What's your biggest concern about AI evaluation in your data products? How are you currently handling the gap between technical accuracy and user trust? I'd love to hear your experiences and challenges.
References
Essential Reading:
- Beyond Vibe Checks: A PM's Complete Guide to AI Evals - Lenny's Newsletter
- Prompt Optimization Guide - Arize
- Your Product Needs Evals - Hamal Husein
- The METRIC Framework for Healthcare AI Data Quality - npj Digital Medicine (2024)
Key Tools:
- Arize AI Phoenix - Open-source LLM observability and evaluation
- Evidently AI - ML monitoring and data drift detection
- LangSmith - LangChain's evaluation and debugging platform
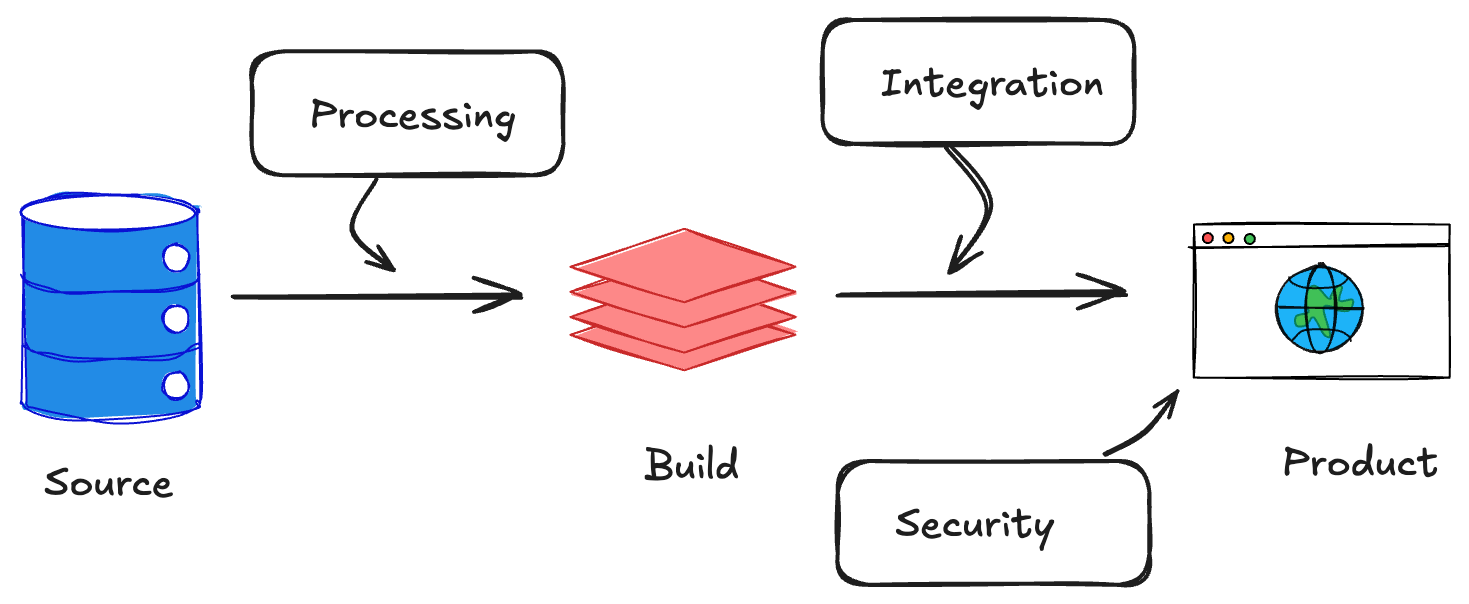
Prototyping with GenAI Tools - A Practical Guide for Data Product Managers
Data PMs face unique challenges: validating complex data relationships and schemas before building. This guide shows how to use GenAI tools to prototype data architectures, generate synthetic data, and test insights - condensing weeks of work into hours.
"In data product development, the cost of being wrong isn't just wasted time—it's wasted opportunity. With GenAI prototyping, we can now validate data assumptions in hours, not months."
Introduction
Data product managers face a unique challenge: efficiently validating complex data relationships, transformations, and visualizations without lengthy development cycles - you gotta build something of value that's sustainable too. GenAI tools are pretty cool i guess: allowing us to condense weeks of engineering effort into minutes. yea, that's nice
While general PMs benefit from faster UI prototyping and all of those fancy design sprints, DPMs can get something from these transformer supported tools too: the ability to validate complex data assumptions early. in this guide i'll share what i've seen work and you'll learn practical approaches to leverage GenAI for data product prototyping, with a focus on what makes our challenges unique
Why Prototyping Matters for Data Products
The Data Product Dilemma
Data products face a unique risk profile. Beyond the typical "Will users understand this interface?" question, data PMs must answer: "are we showing the right data?" "will these insights drive decisions?" "you sure about that chart there chad?!"
GenAI prototyping enables us to rapidly:
- Test visualization effectiveness with realistic data (hopefully realistic but that's on you too)
- Experiment with different data transformations
- Validate data schemas and relationships
- Simulate programmable interactions (API, connection protocols, or MCP actions these days)
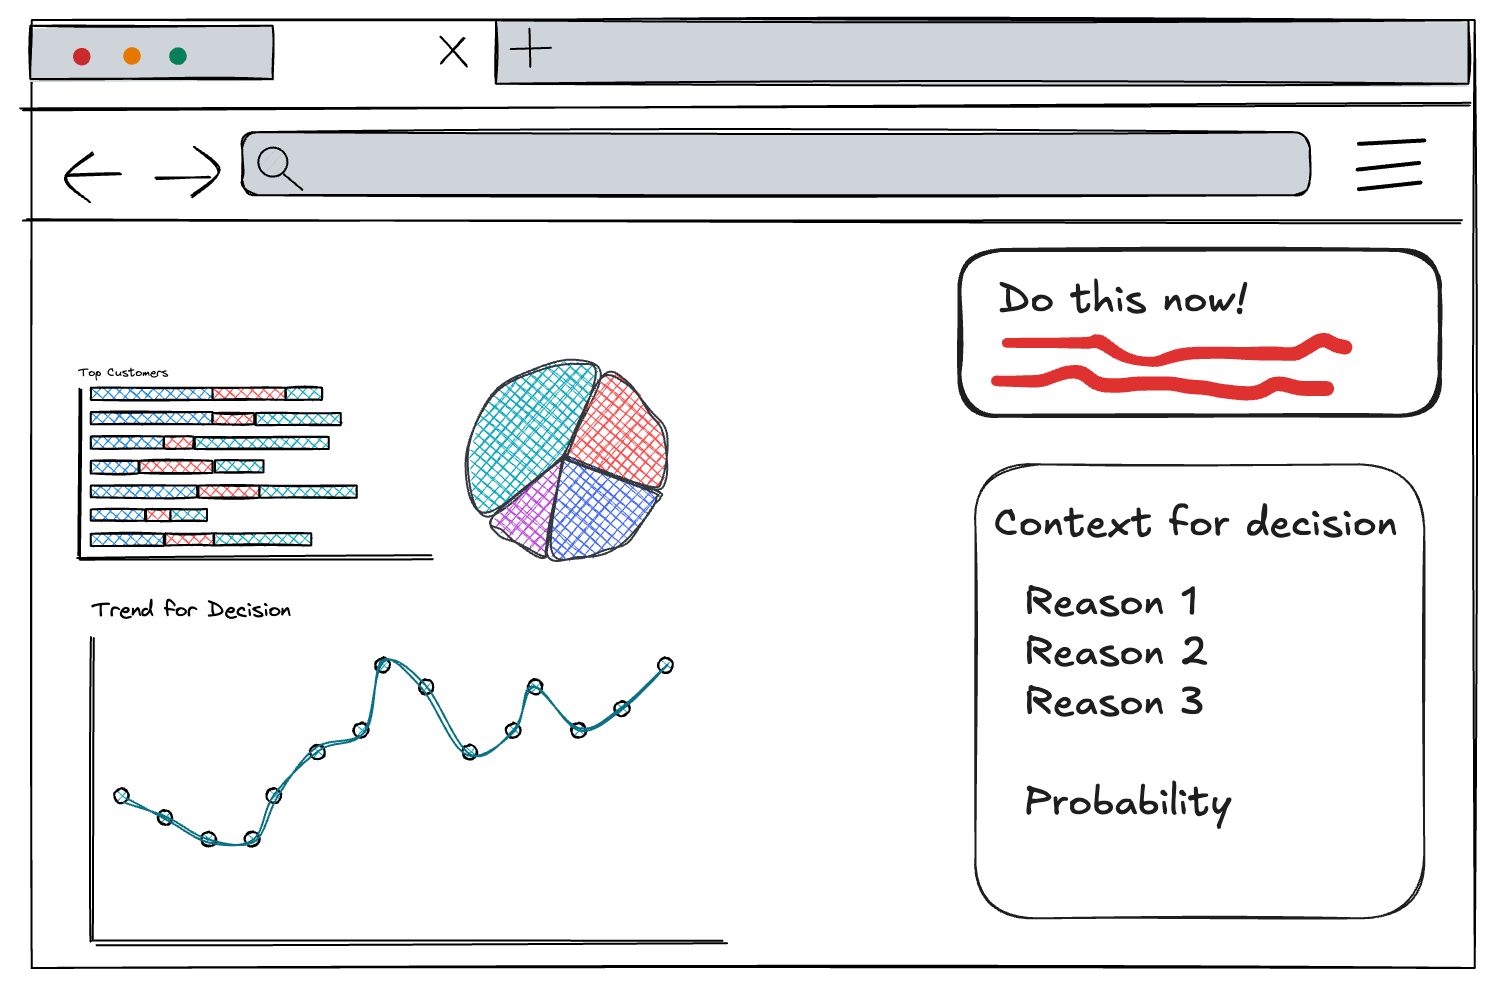
A traditional PRD might specify: "The dashboard will show customer retention metrics with filters for segment and time period." But an interactive prototype reveals critical insights a static specification can't: Which visualization is clearest? What time granularity yields actionable insights? An interactive prototype answers these questions before committing to production code.
Key Challenges for Data PMs
unlike general PMs who focus primarily on interface elements, data PMs must address:
Data complexity: Data products involve relationships between multiple entities, transformations, and business logic that static mockups can't adequately represent.
Accuracy: A beautiful dashboard showing nonsensical data is worse than useless. Prototyping helps validate that algorithmic insights make sense.
Insight delivery: The biggest challenge is ensuring users understand and act on insights. Interactive prototypes reveal comprehension gaps that static designs miss.
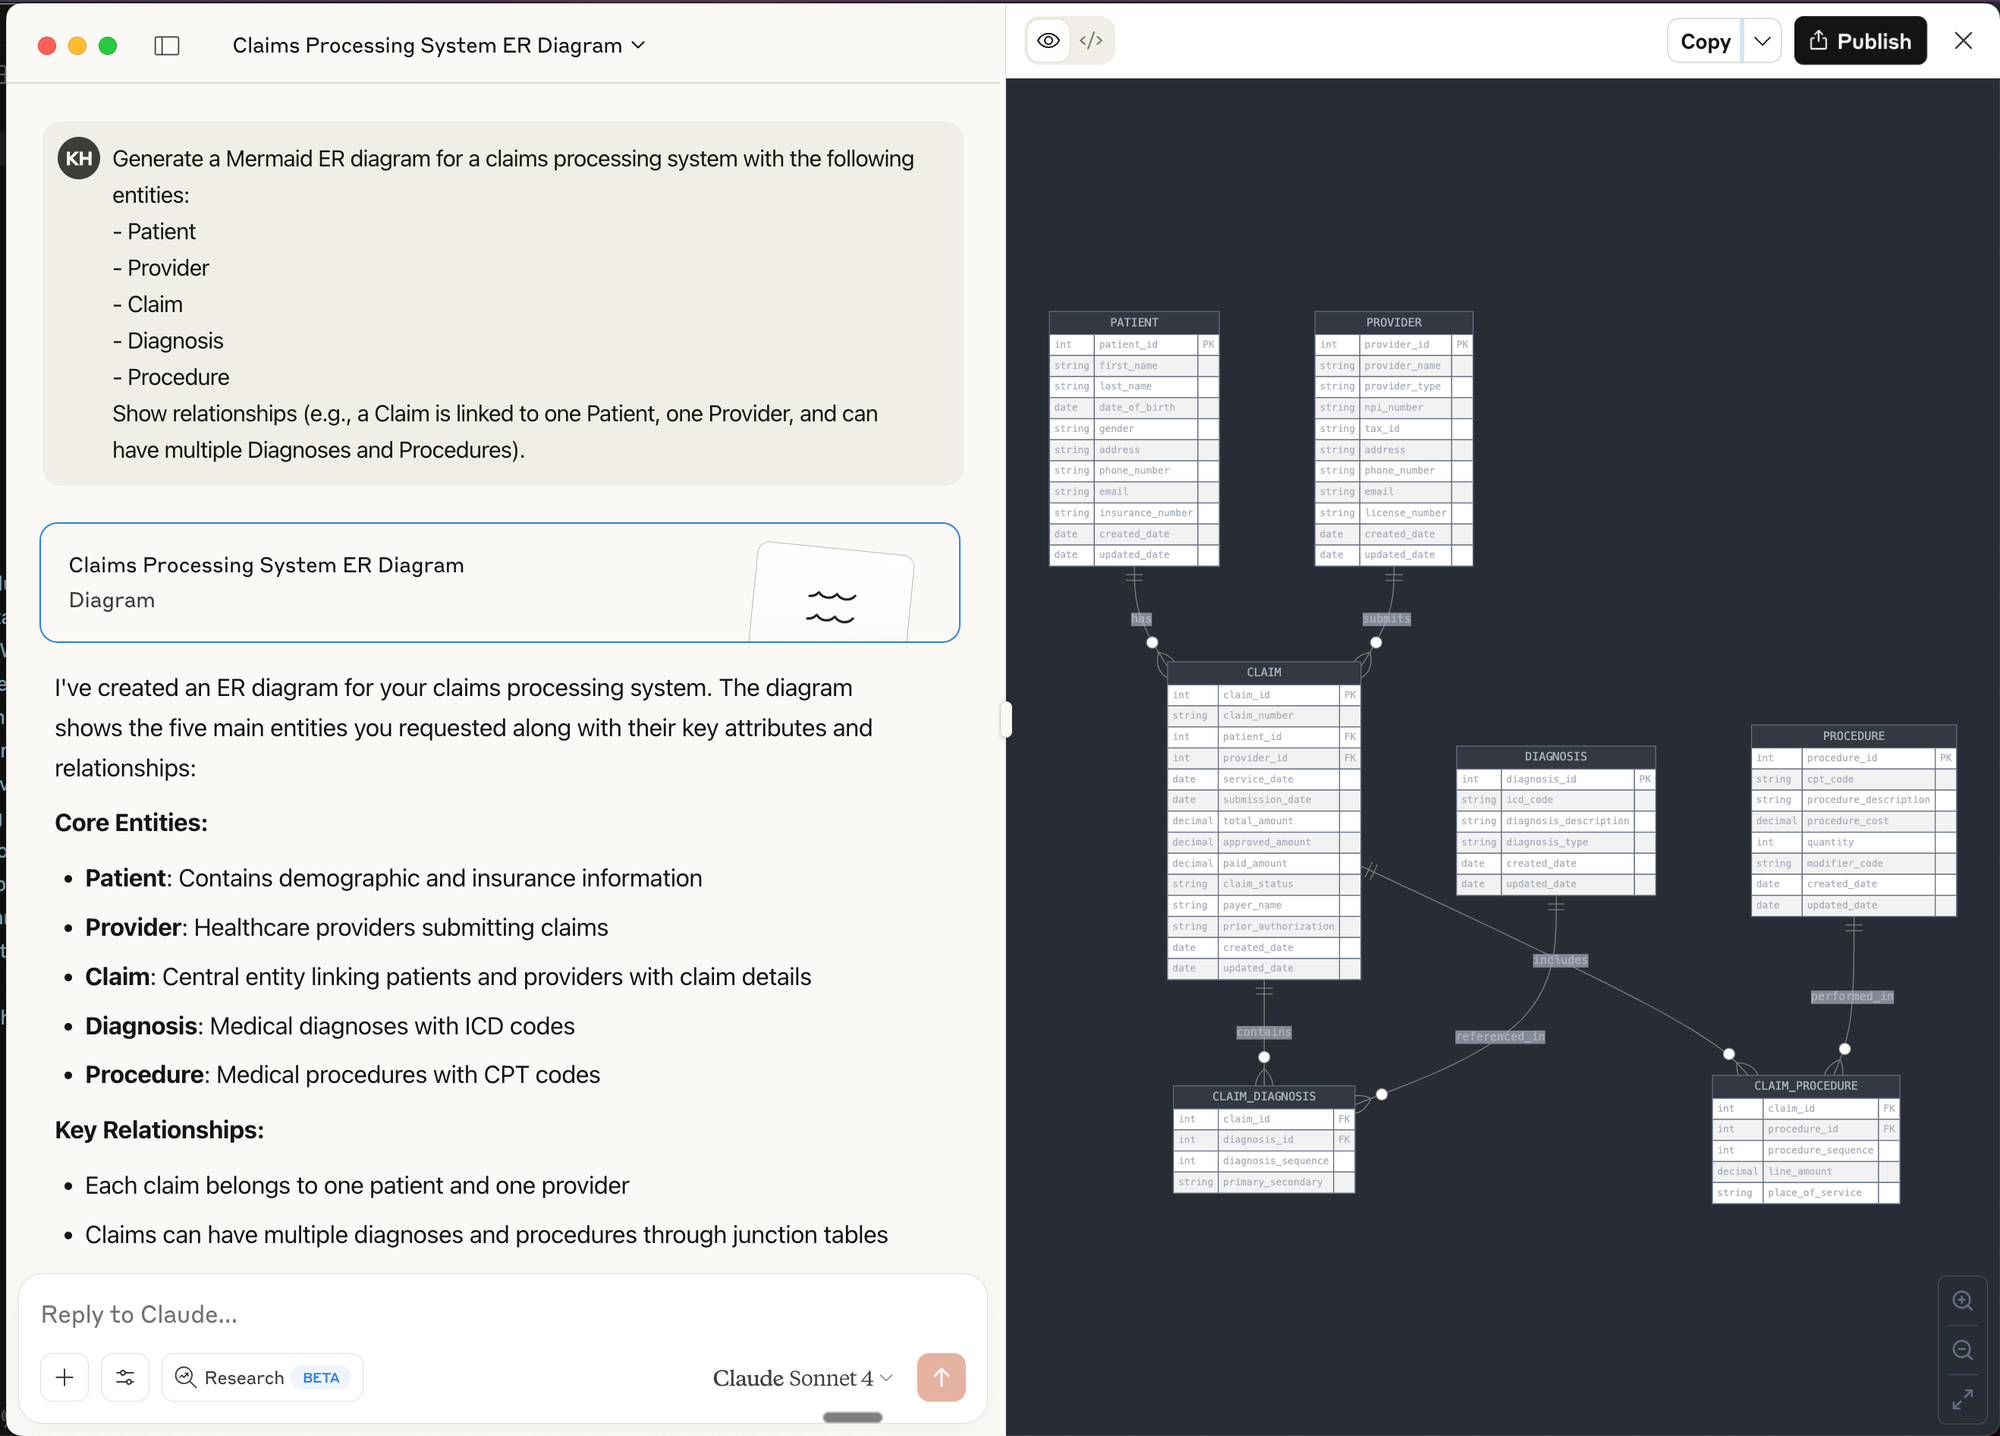
📌 quick win: even a simple interactive data flow diagram built with GenAI can help stakeholders understand complex data relationships better than static documentation. ERD's only get you so far.
GenAI Prototyping Tools for Data Work
The GenAI prototyping landscape can be broken into three categories, each with specific strengths for data product work:
Chatbots (ChatGPT, Claude, Gemini, Grok, Deepseek)
- Best for: Quick data queries, generating sample datasets, simple code snippets
- Limitations: No persistent hosting, limited interactivity
- Data modeling strengths: Schema design suggestions, ERD generation, SQL DDL creation
- Real example: Using Claude to generate JSON datasets of customer transactions
Cloud IDEs (v0, Bolt, Replit, Loveable)
- Best for: Building interactive dashboards, mockable APIs, visualizations
- Data modeling strengths: Creating visual schema explorers, data lineage diagrams
- Top tool for data: Replit (excellent Python support for data work)
- Real example: Building a customer segmentation dashboard with filters and visualizations
Local Developer Assistants (Cursor, Copilot, Windsurf, Claude Code, Codex)
- Best for: Creating sophisticated data transformations, integrating with existing codebases
- Data modeling strengths: Generating migration scripts, building data pipelines, creating dbt models
- Limitations: Requires more technical knowledge
- Real example: Generating and refining synthetic data scripts
For data-specific work, each category has notable strengths. Chatbots excel at quick explorations and data generation but can't host interactive experiences. Cloud IDEs shine for end-to-end data experiences with persistent URLs for stakeholder feedback. Developer assistants offer the highest level of control for DPMs comfortable with code.

DPM insight: choose tools based on your prototype's data complexity, not just UI needs. simple dashboards work well in v0 or Bolt, but complex transformations might require Replit's Python capabilities.
Step-by-Step Workflows for Data Prototyping
From Design to Interactive Data Visualization
Process:
- Start with a dashboard design in Figma
- Extract the design into Bolt or v0
- Add interactive elements using realistic data
- Test with various data scenarios
Key Example: When prototyping a customer lifetime value dashboard, I took a screenshot of our Figma design and asked Bolt to recreate it:
Create a React dashboard that matches this design. It should have a header,
summary metrics showing total customers, average LTV, and retention rate,
and a main area with a bar chart showing customer value by segment.
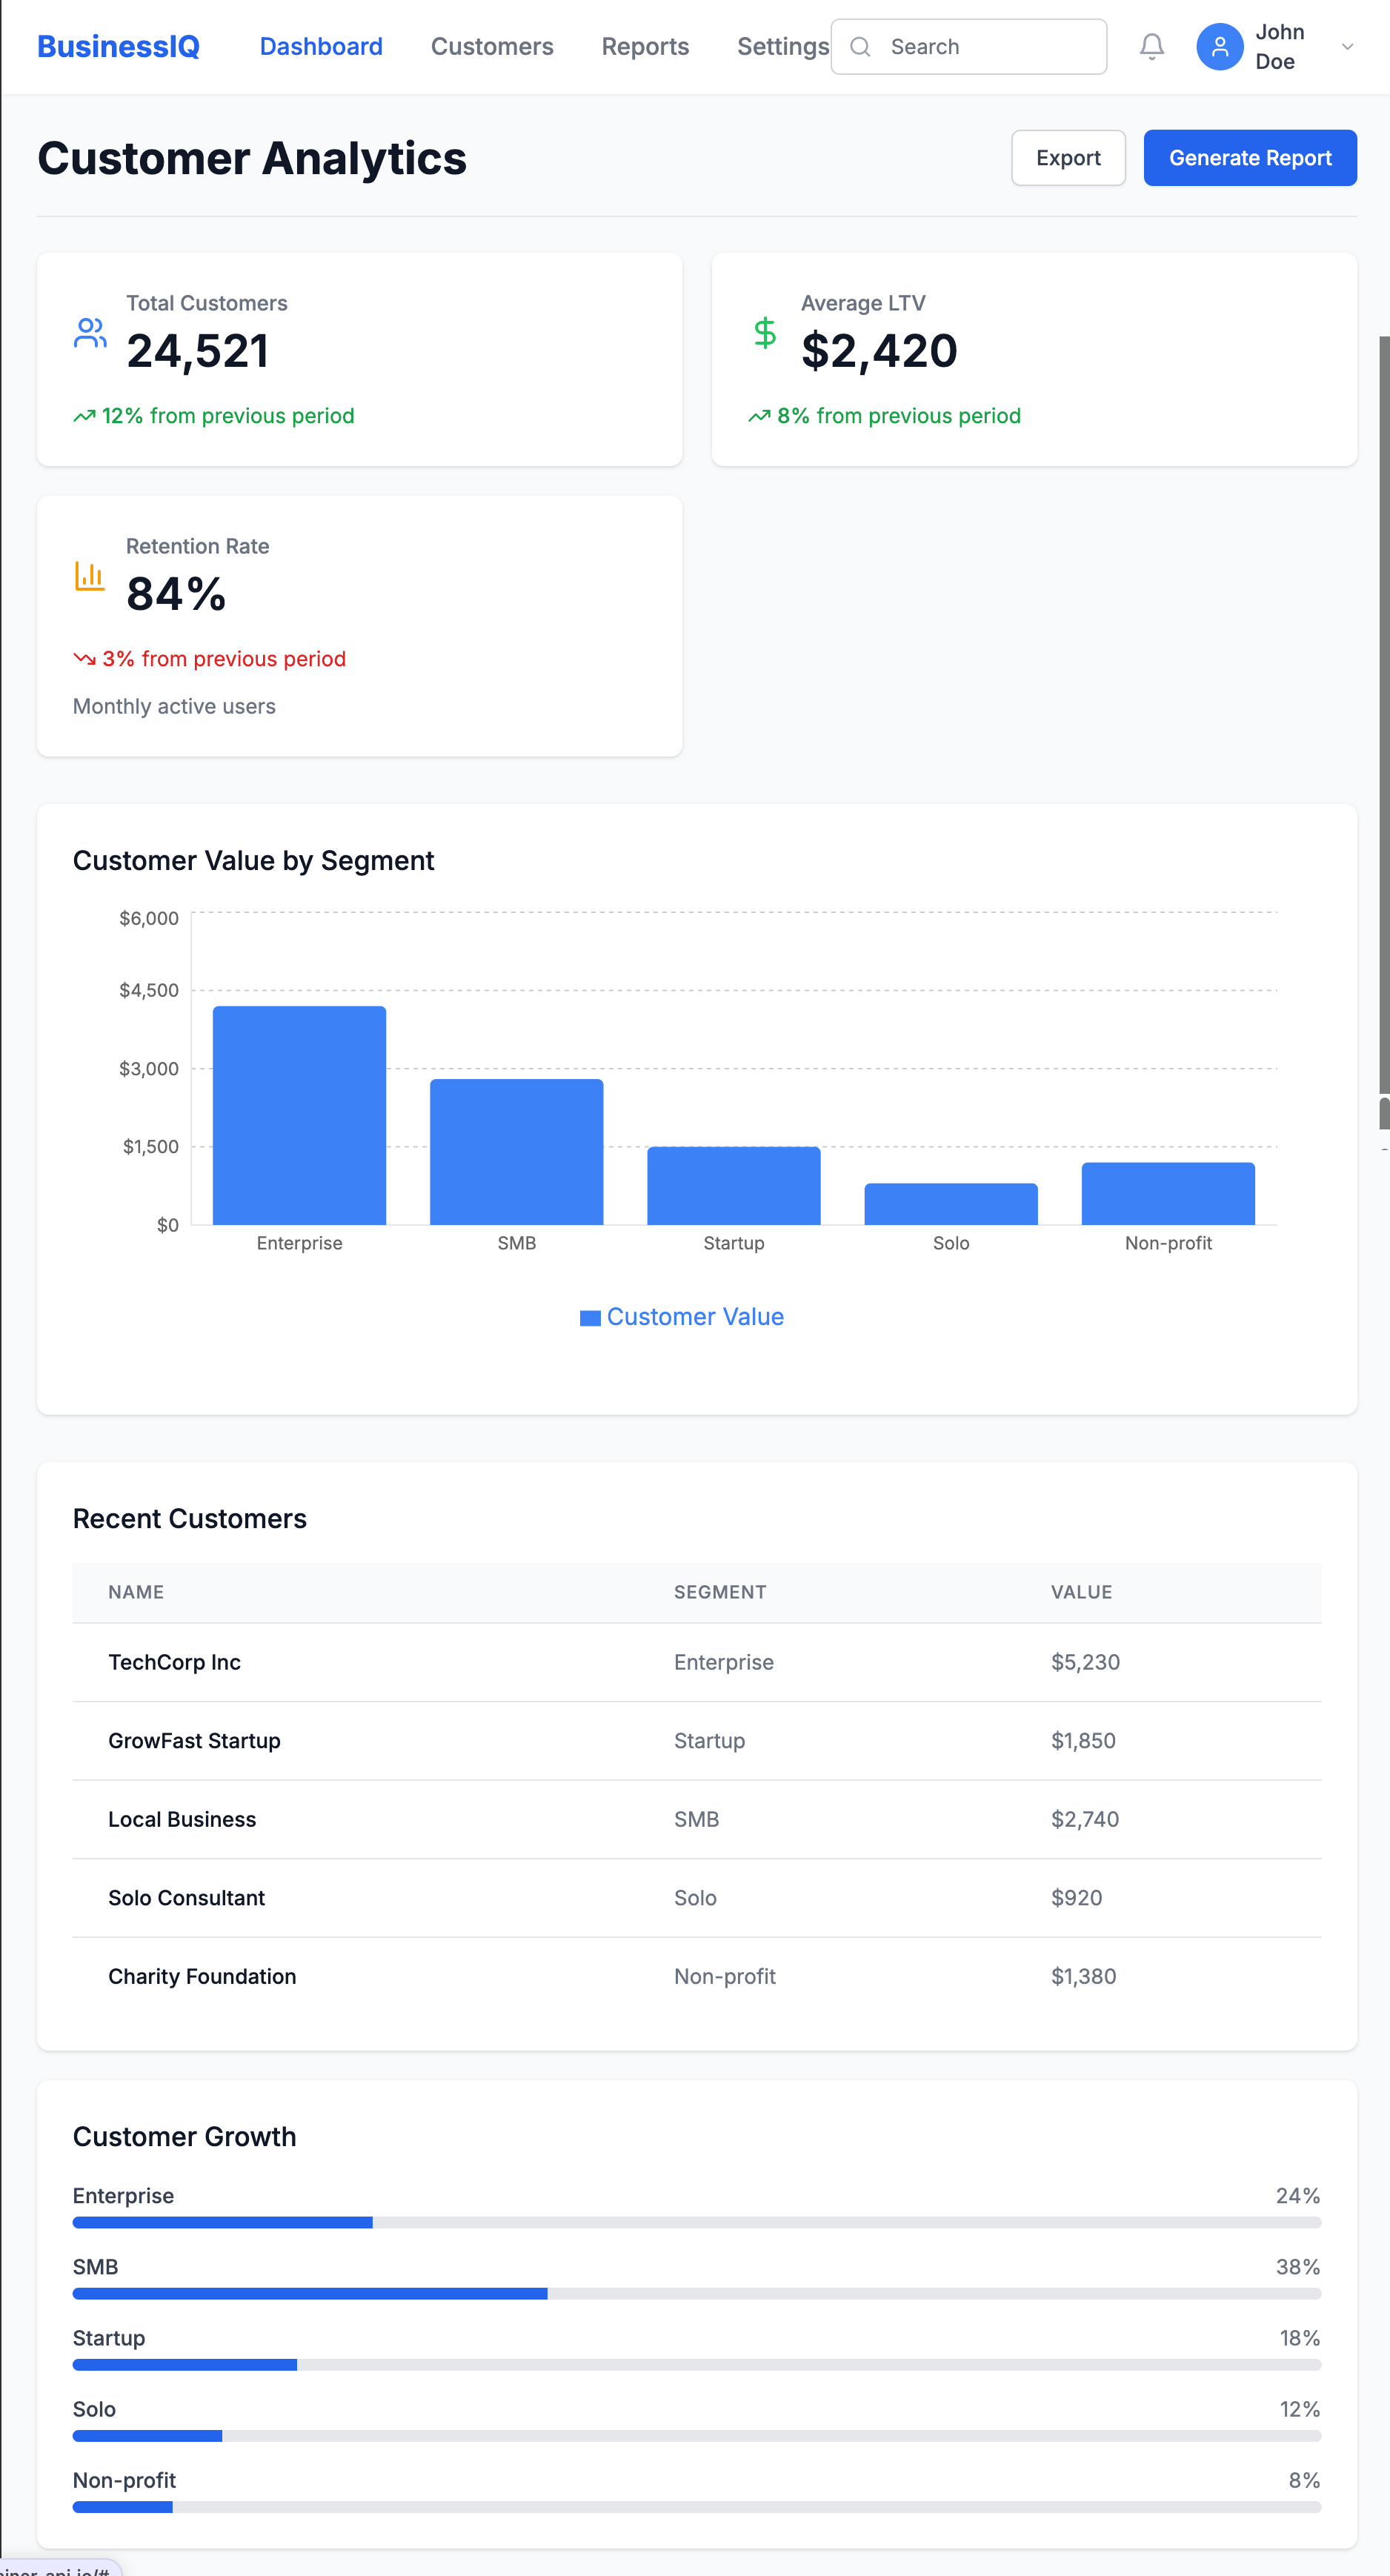
Then added interactivity:
Make the dashboard interactive with:
1. A date range picker that updates all metrics
2. Clickable segments showing detailed breakdowns
3. A CSV upload button for custom data visualization
This quickly revealed insights we'd missed in the static design:
- Users wanted side-by-side segment comparisons
- Year-over-year comparisons were essential
- Data validation for uploads was critical
From PRD to Data-Driven Prototype
Process:
- Extract key data entities from your PRD
- Define mock data schema using an AI assistant
- Build a functional prototype in a cloud IDE
- Test with real users to validate assumptions
Key Example: For a Sankey plot, I first used Claude to define a data schema that would support denormalized EHR data in a wide format. Then built a prototype in Replit that allowed toggling between schema orientation and it was able to implement rough Plotly visuals for this
The prototype revealed critical insights:
- Users were confused by attribution model differences
- We needed to visualize the customer journey alongside attribution
- Teams wanted to see how changing the attribution window affected results
For data products, the proof is in the insights. Focus your prototype on validating that users can understand and act on the data you're providing.
Generating Synthetic Data with GenAI
One critical aspect of data prototyping is generating realistic synthetic data. GenAI tools excel at:
- Volume & variety: Creating thousands of records with appropriate variations
- Format flexibility: Generating data in JSON, CSV, or SQL formats
- Pattern matching: Mimicking statistical distributions with the right prompting
- Range support: building with ranged and IQRs
However, they struggle with:
- Relational integrity: Maintaining consistency across related tables
- Domain accuracy: Ensuring specialized data (medical, financial) reflects real constraints
- Edge cases: Generating unusual but important scenarios
- Logical reliability: continuing that trend of relational extension through iterations
- Outlier building: Developing realistic and unrealistic outliers based on trajectories. For example, in marketing ad spend, a ROAS 10x the avg makes sense dependent on your Monthly Allocated Spend for small brands and scales negatively with budget - ad platforms flag this all the time but it happens!
Here's a sample prompt for limited synthetic data I used a couple of months ago:
Generate a synthetic healthcare claims dataset for prototyping, using open source standards.

Requirements:
- Use the HL7 FHIR Claim resource (or OMOP CDM’s visit_occurrence and drug_exposure tables) as the data model.
- Include 1,000 claims for 200 unique patients over a 12-month period.
- Each claim should have:
  - Patient ID (de-identified)
  - Provider ID
  - Service date
  - Diagnosis codes (ICD-10, 1-10 per claim)
  - Procedure codes (CPT, 0-5 per claim)
  - Drug codes (NDC or RxNorm, if applicable)
  - Total billed amount and paid amount
  - Payer type (Commercial, Medicare, Medicaid)
  - Claim status (Paid, Denied, Pending)
- Ensure realistic distributions (e.g., 70% Commercial, 20% Medicare, 10% Medicaid; 85% Paid, 10% Denied, 5% Pending).
- Vary service dates, codes, and amounts to reflect real-world patterns.
- Output as a CSV or JSON array, with field names matching the FHIR Claim resource (or OMOP table columns).
- Do not include any real patient data—generate all values synthetically.

Optional: Add a few edge cases, such as claims with unusually high amounts, missing diagnosis codes, or denied status due to invalid procedure codes.
key takeaway: the quality of your prototype is directly linked to the quality of your synthetic data. invest time crafting realistic data scenarios that include edge cases > get good at evals (I'll write more about that later but check this out for now --— Beyond vibe checks: A PM’s complete guide to evals
Diagramming & Data Flow Tools (e.g., Mermaid, dbdiagram.io, Lucidchart)
Best for:
- Visualizing data models, entity relationships, and data flows before building
- Communicating architecture and logic to both technical and non-technical stakeholders
- Rapidly iterating on schema or pipeline designs
How to use:
- Use tools like dbdiagram.io to quickly sketch ERDs (Entity Relationship Diagrams) for your data models.
- Use LLM chat interfaces to create Mermaid diagrams (supported in many markdown editors and wikis) to generate flowcharts, sequence diagrams, and even Gantt charts directly from text prompts.
Prompt Example for Mermaid:
Generate a Mermaid ER diagram for a claims processing system with the following entities:
- Patient
- Provider
- Claim
- Diagnosis
- Procedure
Show relationships (e.g., a Claim is linked to one Patient, one Provider, and can have multiple Diagnoses and Procedures).
Prompt Engineering for Data Prototyping Success
The quality of your prompts directly impacts prototype quality. For data work, follow this framework:
Reflection: Start by asking the AI to analyze requirements before writing code.
Based on this data schema, what potential issues should I watch for when designing
a time-series visualization? Consider null values and sparse data periods.
Batching: Break complex data tasks into smaller components.
Let's build this dashboard in stages:
1. First, define the data model
2. Next, create the aggregation logic
3. Then build the visualization component
4. Finally, add filtering capabilities
Specificity: Be precise about data structures and transformations.
Generate a histogram showing user session lengths. The data will be:
[{ "session_id": "s12345", "duration_seconds": 320, "page_views": 4 }, ...]

Group durations into 30-second buckets with tooltips showing count and range.
Context: Provide business context and examples.
In hospital EHR data, friday night visits to ED are typically 30% higher than weekdays, and
morning hours (0730-1100) see peak traffic. Generate sample data matching these patterns.
Common pitfalls to avoid:
- Underspecifying data formats: Vague requests lead to outputs that don't match your needs
- Unclear relationships: Specify how entities relate (one-to-many, etc.)
- Vague data requirements: Include specific distributions, ranges, and business rules
Real-World Case Studies
Rapid Dashboard Prototype for Stakeholder Alignment
Challenge: Our team needed buy-in for a new customer health score methodology.
Approach: Created an interactive dashboard in v0 where stakeholders could adjust factor weights and see how scores changed for different customer segments.
Result: Instead of weeks of theoretical debate, we achieved alignment in two days. Stakeholders discovered we needed to normalize scores by customer size—something we would have missed without the interactive experience.

Validating a New Data-Driven Feature
Challenge: We hypothesized users would value a new "composite symptom" metric against multiple scales in our healthcare dataset.
Approach: Built a Replit prototype that allowed users to:
- View their simulated score
- See the calculation methodology
- Explore how behavior changes would affect their score
- Compare against benchmarks
Result: We discovered:
- Users valued the concept but needed more contextual information
- Comparisons to similar users mattered more than absolute scores
- The term "efficiency" confused users; "productivity impact" resonated better
- Users wanted actionable recommendations based on the score
These insights saved months of development on a feature that would have missed the mark.
Actionable Takeaways for Data PMs
Tool Selection Framework
Use chatbots for:
- Quick data exploration
- Simple data generation
- Single-use code snippets
Use cloud IDEs for:
- Shareable interactive prototypes
- Data visualizations with filtering
- End-to-end simulated experiences
Use developer assistants for:
- Complex data transformations
- Integration with existing code
- Production-quality implementations
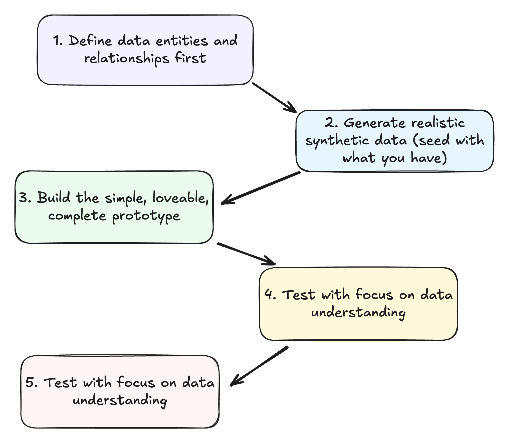
The Data Prototype Workflow
- Define data entities and relationships first
- What objects comprise your data model?
- How do they relate to each other?
- Generate realistic synthetic data
- Include common patterns and edge cases
- Ensure data reflects business realities
- Build the minimum viable prototype
- Focus on validating key assumptions
- Make it just interactive enough to test your hypothesis
- Test with focus on data understanding
- Can users derive meaningful insights?
- Do they understand what metrics mean?
- Iterate based on data value feedback
- Refine the data model based on insights
- Adjust visualizations to better communicate meaning
De-risking Data Products Through Prototyping
Leverage GenAI prototypes to validate:
Data assumptions: Test whether your understanding of the data is correct before building.
User value: Confirm insights actually solve user problems in a meaningful way.
Technical feasibility: Verify your proposed architecture will work as expected.
Stakeholder alignment: Build consensus through interactive demonstrations that make abstract concepts tangible.
success story: "We used to spend 3 weeks building data visualization prototypes. With GenAI tools, we reduced that to 2 days, and the quality of feedback improved because stakeholders could interact with real data." - VP Data, Health System

Further Resources & Next Steps
Learning Resources:
- Streamlit Documentation - For building data apps in Python/replit
- Observable - Interactive data visualization playground
- "Storytelling with Data" by Cole Nussbaumer Knaflic
- GenAi prototyping for product managers
- Anthropic - prompt engineering overview
- Ideo - Prototyping Overview
- Beyond vibe checks: A PM’s complete guide to evals
Take Action Today:
- Create a simple dashboard prototype using v0 or Bolt
- Practice generating synthetic data with Claude or ChatGPT
- Share your prototyping experiments with your team - don't be afraid but yes, they might laugh at you
TL;DRPricing data products is a different beast from SaaS—value is contextual, and the product layer matters as much as the data.Start by understanding what makes your data valuable (to whom, and why).Layer on product experience: APIs, dashboards, integrations, and support are all pricing levers.Use a mix of usage-based and value-based models; experiment with tiers, access, and outcomes.Don't ignore industry quirks, legal, and compliance—these can make or break your pricing.Treat pricing as a living product: monitor, adapt, and evolve as the market shifts.The future? More AI (all types), more outcome-based pricing, and a premium on privacy and real-time data.
Introduction
Data is often called the new oil, but it's also the new currency—valuable, but only in the right context, and not always fungible (St. Andrews Economist, 2023).
Every data product manager eventually faces the same question: How much is this data actually worth? And how do I price not just the data, but the product built around it?
If you've ever felt like you're making it up as you go along, you're not alone. Pricing data (and data products) is one of the most misunderstood—and most consequential—challenges in the field.
Unlike SaaS, where pricing models are well-trodden and benchmarks abound, data products live in a world of ambiguity. The value of a dataset can change depending on the use case, the user, and even the day of the week. The product layer—APIs, dashboards, analytics—adds another dimension of complexity.
In this post, we'll break down the art (pricing really is art) and science of data product pricing. We'll explore:
- why traditional SaaS pricing models fall short
- how to think about the value of data as an asset
- how to combine asset and product thinking into a practical pricing strategy
Whether you're launching your first data product or rethinking the pricing of an established offering, this guide will help you navigate the unique challenges—and opportunities—of pricing in the data economy. It's a space for me to put down thoughts and share them broadly
Understanding Data Asset Value
Fundamental Principles
Before you can price a data product, you have to understand what gives data its value in the first place. This is where most teams stumble. Data isn't like software code or a physical good—it doesn't have intrinsic value. Its worth is entirely contextual, shaped by who's using it, how, and for what purpose.

1. Data has no innate value—value derives from utility.
A dataset sitting on a hard drive is just a cost center. It only becomes valuable when it helps someone make a better decision, automate a process, or unlock a new opportunity. For example, a list of retail transactions is worthless to a hospital, but gold to a consumer analytics firm.
2. Value depends on use case and user.
The same dataset can be worth pennies to one customer and millions to another. A hedge fund might pay a premium for satellite imagery of parking lots to predict retail earnings, while a logistics company might see little use for it. Always ask: Who will use this data, and what will they do with it?
3. The additive nature of data.
Data's value often increases when combined with other datasets. A customer list is more valuable when enriched with demographic or behavioral data. This "additive" property means that even seemingly commoditized data can become differentiated through clever integration.
4. Rivalry vs. non-rivalry.
Unlike physical goods, data can be sold to multiple customers without being "used up." But exclusivity can drive up value—if you're the only one with access to a unique dataset, you can command a premium. Decide early: Are you selling exclusivity, or scale?
Value Drivers
What helps establish the "value" and the price you set? Quality + positioning.
Quality Metrics
- Accuracy and completeness: Is the data correct and comprehensive? Inaccurate or missing data erodes trust and value.
- Freshness and timeliness: How up-to-date is the data? For financial trading, even a few seconds' delay can make data worthless.
- Uniqueness and exclusivity: Is this data available elsewhere? Unique or proprietary data is always more valuable.
- Coverage and granularity: Does the data cover the right scope (e.g., all US hospitals) and at the right level of detail (e.g., daily vs. monthly)?
Market Position
- Lifecycle stage: Is your data a new "alpha" source, or has it become a commodity? Early-stage, high-impact data commands higher prices.
- Market maturity: In mature markets, pricing is often driven down by competition. In emerging spaces, you can set the rules.
- Competitive landscape: Are there substitutes? If so, what are their strengths and weaknesses?
- Barriers to entry: How hard is it for others to replicate your data? Proprietary collection methods, regulatory approvals, or unique partnerships can all create defensibility.
Example: When I worked with a healthcare data provider, we found that our claims dataset was only moderately valuable on its own. But when we layered in hospital quality scores and patient satisfaction data, the combined product became a must-have for payers and providers looking to benchmark performance. The value wasn't in the raw data, but in the unique combination and the insights it enabled.
Want more of this in your inbox?
Takeaway:
Before you think about pricing, get brutally honest about what makes your data valuable—and to whom. Map out your value drivers, assess your defensibility, and be clear about whether you're selling a commodity or a crown jewel. This clarity will shape every pricing decision that follows.
Product Layer Pricing
Once you've mapped the value of your data asset, it's time to layer on the product. This is where many data teams get tripped up: they price the data, but forget to price the product experience that surrounds it. In reality, the product layer is often where the most defensible value—and differentiation—lives.
If your data is a commodity, your product experience is your moat. If your data is unique, your product can multiply its value.
Infrastructure Components
Think of this as the "plumbing" that makes your data usable:
- Data processing and storage costs: How much does it cost to clean, process, and store the data? These are your baseline costs, but also a source of value if you can offer faster, more reliable, or more secure delivery than competitors.
- API and delivery mechanisms: Are you providing raw data dumps, or real-time APIs? The latter can command a premium, especially if you offer robust uptime, low latency, and strong documentation.
- Integration capabilities: The easier it is for customers to plug your data into their workflows (via connectors, SDKs, or pre-built integrations), the more you can charge.
- Security and compliance features: In regulated industries, features like audit trails, encryption, and compliance certifications (HIPAA, SOC 2, etc.) are not just table stakes—they're pricing levers.
User Experience Elements
This is where you turn data into decisions:
- Interface and visualization: Dashboards, reports, and visualizations make data actionable. A beautiful, intuitive interface can be the difference between a "nice-to-have" and a "must-have."
- Self-service capabilities: Can users explore, filter, and analyze data on their own? Self-service tools reduce support costs and increase perceived value.
- Documentation and support: Great docs and responsive support are often overlooked, but they're critical for adoption—especially for technical buyers.
- Custom features and functionality: Alerts, scheduled reports, or custom analytics can justify higher price points, especially for enterprise customers.
The best data products don't just deliver data—they deliver outcomes and trust. Price for the value your product enables, not just the bytes you ship.
Takeaway:
When pricing your data product, don't stop at the data. Map out every layer of the product experience, from infrastructure to interface. Each layer is a potential pricing lever—and a chance to differentiate in a crowded market.
Combined Pricing Strategies
So, you've mapped your data's value and built a product around it. Now comes the million-dollar question: How do you actually charge for it? The answer is rarely simple, but the best data product pricing strategies blend usage-based and value-based models, with plenty of room for creativity.
There's no one-size-fits-all model - sorry to break it to you. The right pricing strategy depends on your data, your product, your market, and your customers' willingness to pay.

Pricing Models
Usage-Based
Usage-based pricing is intuitive for data products. Customers pay for what they consume—whether that's rows of data, API calls, or number of users. This model aligns cost with value delivered, and scales as your customers grow.
- Volume tiers: Charge based on the amount of data accessed (e.g., 1M rows/month, 10M rows/month, etc.).
- Query-based pricing: Price per query or report generated, common in analytics and BI products.
- API calls: Charge per API request, with discounts for higher volumes.
- User seats: Price by the number of users or seats accessing the product.
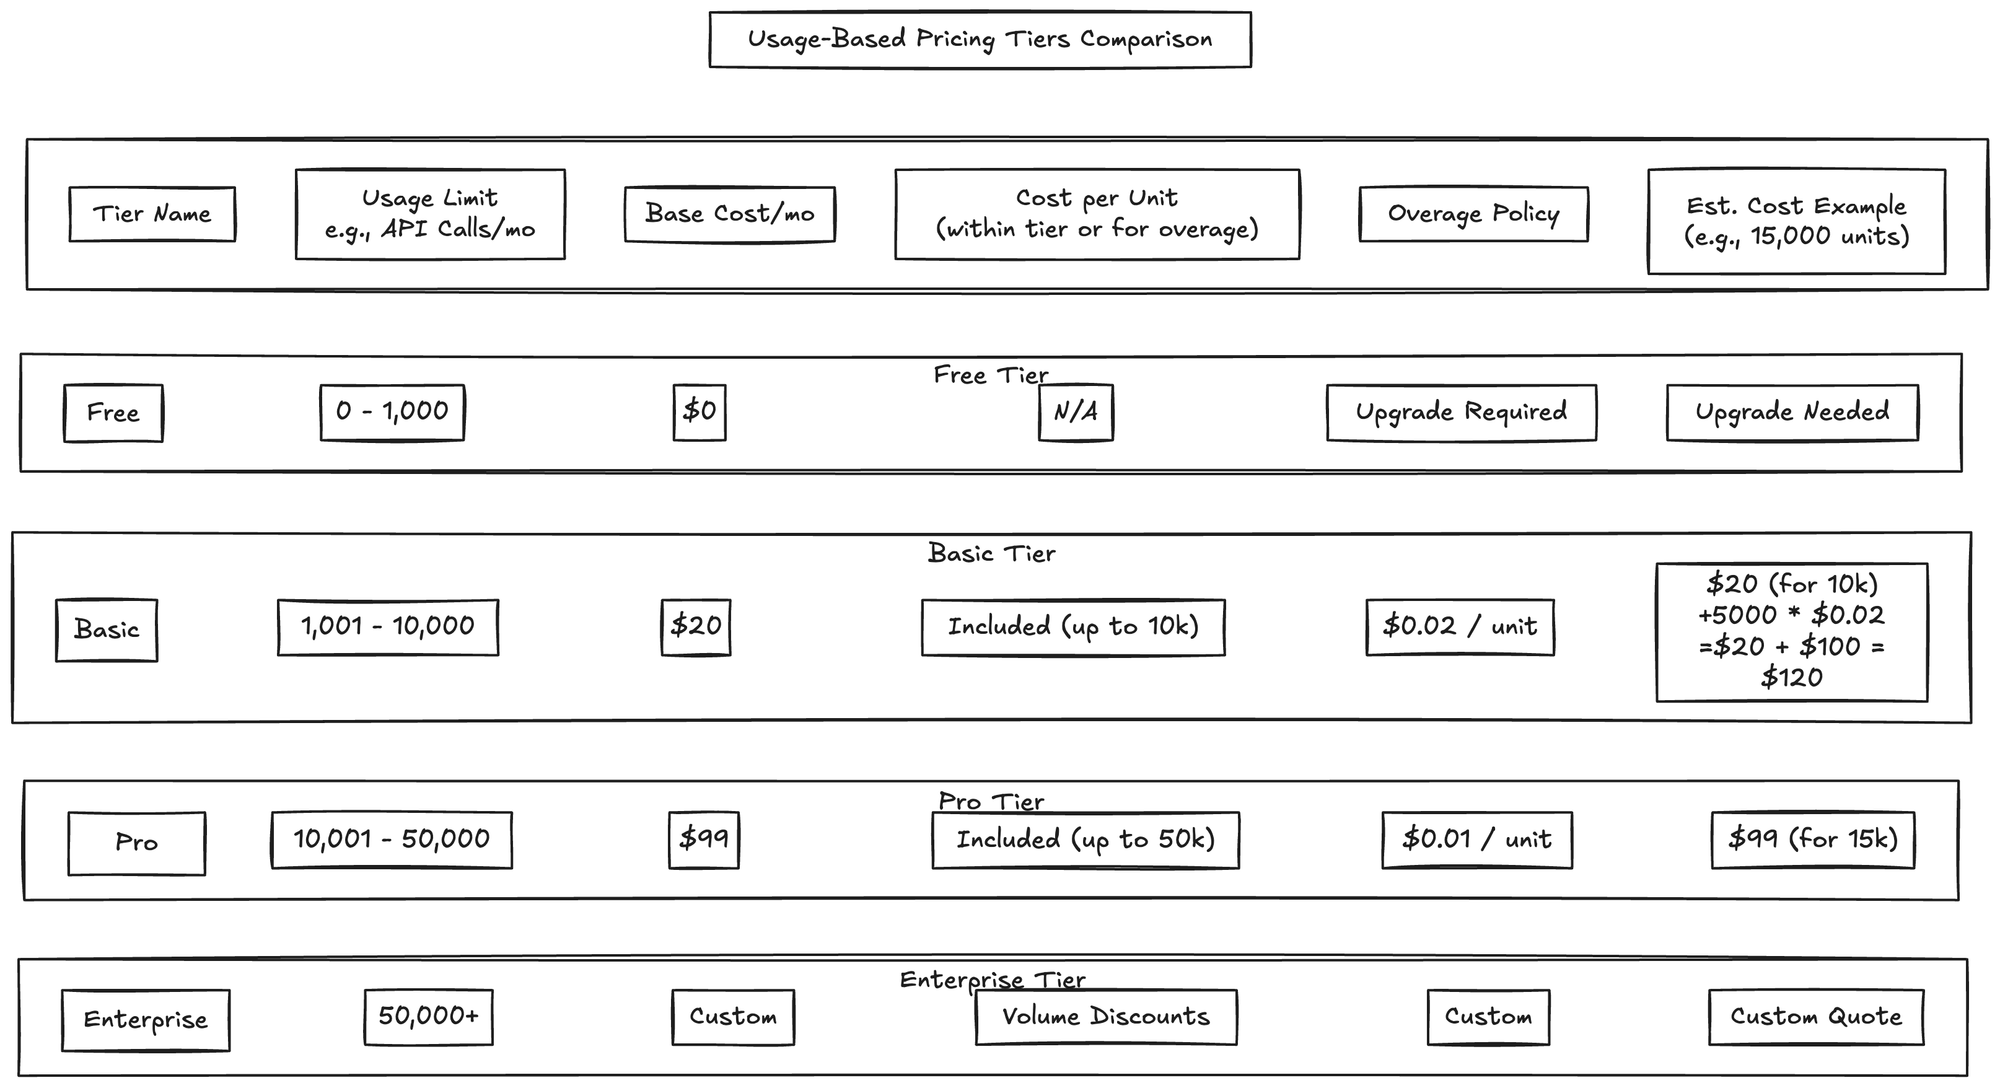
Visual suggestion: Table or chart comparing different usage-based pricing tiers, showing how costs scale with usage.
Value-Based
Value-based pricing is about charging for outcomes, not just inputs. This model works best when you can tie your product to a clear ROI or business impact.
- Industry-specific metrics: Price based on metrics that matter to your customer (e.g., dollars saved, revenue generated, risk reduced).
- ROI-based pricing: If your data product helps a customer save $1M, charging $100K is a no-brainer.
- Outcome-based models: Charge only when a certain result is achieved (e.g., successful fraud detection, leads generated).
- Risk-sharing arrangements: Offer performance guarantees or share in upside to align incentives.
Value-based pricing requires deep customer understanding and trust. It's harder to implement, but can unlock much higher price points.
Pricing Levers
These are the dials you can turn to fine-tune your pricing and segment your market:
- Access levels: Raw data vs. processed data, or basic vs. premium features.
- Update frequency: Real-time updates command a premium over daily or weekly refreshes.
- Historical depth: More history = higher price.
- Geographic coverage: Global data costs more than regional or local.
- Usage rights and restrictions: Exclusive access, redistribution rights, or white-labeling can all justify higher prices.

Framework: Building Your Pricing Model
- Start with your value drivers: What do your best customers care about most?
- Choose your base model: Usage-based, value-based, or a hybrid.
- Layer on pricing levers: Create tiers or packages that match different customer needs.
- Test and iterate: Pricing is never "set and forget." Talk to customers, run experiments, and adjust as you learn.
Takeaway:
The best data product pricing strategies are flexible, transparent, and aligned with customer value. Don't be afraid to experiment—and remember, your pricing model is a product in itself.
Implementation Framework
You've mapped your value, built your product, and chosen a pricing model. Now it's time to put it all together in a way that's both rigorous and adaptable. The best pricing frameworks are grounded in reality—your costs, your market, and your customers' needs.
Pricing is a process, not a one-time event. The best teams revisit and refine their pricing as their product and market evolve.
Assessment Phase
Internal Analysis
- Cost structure: Start by understanding your true costs—data acquisition, processing, storage, delivery, support, and compliance. Don't forget hidden costs like customer onboarding or custom integrations.
- Marginal costs: For most data products, the cost to serve one more customer is low, but not zero. Know your margins so you can price profitably.
- Scalability factors: Can your infrastructure handle 10x more customers? If not, factor in the cost of scaling.
- Operational constraints: Are there limits to how much data you can deliver, or how quickly you can onboard new clients?
Visual suggestion: Cost breakdown chart or waterfall diagram showing how costs accumulate from raw data to delivered product.
Market Analysis
- Customer segmentation: Not all customers are created equal. Segment by industry, company size, use case, or willingness to pay.
- Competitive positioning: Map your competitors' offerings and pricing. Where can you differentiate? Where are you at risk of commoditization?
- Market size and potential: Is your market growing, shrinking, or saturated? This will shape your pricing ambition.
- Industry-specific factors: Regulatory requirements, procurement cycles, and industry norms can all impact pricing.
Talk to real customers early and often. Pricing is as much about perception as it is about math.
Pricing Structure Design
Base Components
- Core offering definition: What's included in your base package? Be clear about what's "standard" and what's extra.
- Minimum viable product: Don't overbuild. Start with the smallest set of features that delivers real value.
- Essential features: Identify the must-haves for your target segment. Everything else can be an add-on or upsell.
Premium Elements
- Advanced capabilities: Machine learning, predictive analytics, or custom reporting can justify higher tiers.
- Enhanced service levels: Faster SLAs, dedicated support, or custom onboarding are all premium levers.
- Custom solutions: For enterprise clients, be ready to price bespoke integrations or data feeds.
- Professional services: Training, consulting, or data science services can be valuable add-ons.
Example:
A B2B data platform might offer a "Starter" tier with basic data access and self-service analytics, a "Professional" tier with advanced integrations and premium support, and an "Enterprise" tier with custom data feeds and dedicated account management. Each tier is priced to match the value delivered—and the cost to serve.
Takeaway:
A robust implementation framework grounds your pricing in reality and gives you the flexibility to adapt as you learn. Don't be afraid to start simple and add complexity as your product and market mature.
Special Considerations
Even the best pricing model can be derailed by industry quirks, legal landmines, or compliance hurdles. Data products live at the intersection of technology, regulation, and business—and each industry brings its own set of challenges.
Ignore industry and legal context at your peril. The right pricing in the wrong regulatory environment can kill a deal—or your whole business.
Industry-Specific Factors
- Financial services: Data freshness and accuracy are paramount. Regulatory requirements (e.g., SEC, FINRA) can dictate how data is delivered and priced. High-value, low-latency data often commands a premium, but must be auditable and secure.
- Healthcare: HIPAA and other privacy laws shape what data can be sold, to whom, and how it must be protected. De-identification, consent, and audit trails are not just features—they're requirements. Pricing must reflect the cost and risk of compliance.
- Marketing/AdTech: Privacy regulations (GDPR, CCPA) are tightening. Data provenance, consent management, and opt-out mechanisms are now table stakes. Expect more scrutiny on how data is sourced and used.
- AI/ML training data: The value of training data is skyrocketing, but so are concerns about bias, copyright, and ethical use. Pricing must account for exclusivity, labeling quality, and downstream liability.
Visual suggestion: Matrix or infographic showing how pricing levers and compliance requirements vary by industry (e.g., healthcare vs. finance vs. AdTech).
Legal and Compliance
- Data ownership: Who owns the data you're selling? If it's aggregated from third parties, do you have the rights to resell it? Clear contracts and provenance are essential.
- Usage rights: Define exactly how customers can use your data—internal analysis, redistribution, commercial resale, etc. More rights = higher price (and higher risk).
- Privacy regulations: Stay current on global privacy laws. Non-compliance can mean massive fines and reputational damage.
- Industry compliance: Certifications (SOC 2, ISO 27001, HITRUST) can be a differentiator—and a pricing lever—in regulated markets.
Legal and compliance costs aren't just overhead—they're part of your value proposition. Customers will pay more for data they can trust.
Takeaway:
Build compliance and industry context into your pricing from day one. It's easier (and cheaper) to get it right up front than to retrofit your product or pricing later.
In a world of infinite, AI-generated content, the ability to prove your data's origin, quality, and curation will command a premium. Trust chains and provenance are the new differentiators (Pivotal, 2023).
Optimization and Evolution
Pricing isn't a "set it and forget it" exercise. The best data product teams treat pricing as a living system—constantly monitored, tested, and refined as the market, product, and customer needs evolve.
Your first pricing model will be wrong. The winners are those who learn and adapt the fastest.
Monitoring and Metrics
- Usage patterns: Track how customers actually use your product. Are they hitting usage caps? Abandoning after onboarding? These signals can reveal both pricing friction and upsell opportunities.
- Customer feedback: Regularly ask customers about perceived value, pain points, and what would make them pay more (or less).
- Market changes: Keep an eye on competitors, new entrants, and shifting industry standards. What was premium last year may be table stakes today.
- Cost evolution: As your infrastructure scales, your cost structure will change. Revisit your margins and adjust pricing as needed.
Adaptation Strategies
- Version upgrades: Use new features or data sources as opportunities to revisit pricing. Don't be afraid to grandfather existing customers while raising prices for new ones.
- Market expansion: As you move into new segments or geographies, test different pricing models to find the right fit.
- Feature additions: Launching a major new capability? Consider a new tier or add-on rather than bundling it into your base price.
- Pricing adjustments: Don't wait for a crisis to adjust pricing. Small, regular tweaks are less risky than big, infrequent overhauls.
Communicate pricing changes transparently and early. Customers are more forgiving when they understand the "why."
Takeaway:
Treat your pricing like a product—iterate, test, and improve. The most successful data product companies are relentless about learning from the market and evolving their pricing to match.

Specific Pricing Frameworks by Data Product Type
No two data products are priced the same. The right framework depends on your data's nature, your customers, and your market. Here's how to approach pricing for the most common data product types, with examples and callouts for what makes each unique.
1. Market Data Products
Market data (e.g., financial, economic, or industry feeds) is all about speed, accuracy, and coverage. Customers pay for freshness and reliability.
- Pricing approach: Tiered by latency (real-time, delayed), history depth, and coverage. Premium for real-time, global, or exclusive access.
- Unique considerations: Regulatory requirements, auditability, and SLAs are often non-negotiable.
- Example: A stock market data provider might offer delayed data for free, real-time for a fee, and exclusive pre-market feeds at a premium.
2. Alternative Data Products
Alternative data (e.g., satellite imagery, web scraping, IoT signals) is prized for its uniqueness and alpha potential.
- Pricing approach: Priced by uniqueness, exclusivity, and integration complexity. Custom deals are common.
- Unique considerations: Data provenance, legal rights, and integration support are key differentiators.
- Example: A hedge fund pays a premium for exclusive access to a new geolocation dataset that predicts retail foot traffic.
The rarer the data, the more you can charge—especially if you offer exclusivity.

3. B2B Data Intelligence Products
These products (e.g., company info, contact data, industry insights) are all about breadth, accuracy, and enrichment.
- Pricing approach: Tiered by records accessed, enrichment level, and user seats. API access and export limits are common levers.
- Unique considerations: Data freshness, compliance (GDPR), and enrichment features drive value.
- Example: A sales intelligence platform charges by the number of contacts accessed and the depth of company profiles.
4. Consumer Data Products
Consumer data (e.g., demographics, behavior, transactions) is highly regulated and privacy-sensitive.
- Pricing approach: Segmented by audience size, data freshness, and segmentation complexity. Premium for custom segments or analytics.
- Unique considerations: Privacy compliance (GDPR, CCPA), consent management, and opt-out mechanisms are essential.
- Example: A marketing platform charges more for real-time behavioral data and custom audience segments.
5. AI Training Data Products
Training data for AI/ML models is all about quality, labeling, and exclusivity.
- Pricing approach: Priced by data volume, labeling quality, and exclusivity. Custom collections and co-creation deals are common.
- Unique considerations: Bias, copyright, and downstream liability must be addressed in contracts and pricing.
- Example: An AI startup pays a premium for a large, expertly labeled medical image dataset, with exclusivity for a year.
6. IoT/Sensor Data Products
IoT data (e.g., sensor feeds, telemetry) is valued for real-time access and integration ease.
- Pricing approach: Tiered by number of sensors, data frequency, and storage duration. Platform access and analytics tools are upsell levers.
- Unique considerations: Integration APIs, uptime guarantees, and data retention policies matter.
- Example: A logistics company pays for real-time fleet tracking, with higher tiers for historical analytics and API integrations.
7. Analytics Data Products
Analytics products (e.g., dashboards, reporting tools) turn raw data into insights and decisions.
- Pricing approach: Tiered by data volume, processing complexity, user seats, and export capabilities. Freemium models are common for self-service tools.
- Unique considerations: Custom reporting, white-labeling, and advanced analytics can justify premium tiers.
- Example: A BI platform offers a free tier for basic analytics, with paid plans for advanced features and higher data limits.
Implementation Guidelines
- Start with the simplest pricing model that captures value for your segment.
- Consider hybrid models for different customer types (e.g., usage-based for SMBs, custom contracts for enterprise).
- Build in scalability and clear upgrade paths.
- Plan for customization requests—these are often your highest-margin deals.
Common Patterns
- Freemium works best for high-volume, self-service products.
- Enterprise pricing is needed for high-touch, complex solutions.
- Usage-based pricing aligns well with customer value and growth.
- Tiered access helps segment the market and drive upsell.
- Custom pricing is often required for unique or high-value datasets.
Takeaway:
There's no universal playbook, but these frameworks will help you match your pricing to your product's unique strengths and your customers' real needs. Use visuals, clear tiering, and transparent value drivers to make your pricing easy to understand—and easy to buy.
Future Trends
The only thing certain about data product pricing? It's going to change—fast. New tech, new rules, and new customer demands are rewriting the playbook every year. Here's what to keep on your radar as you build for tomorrow.
Change is the only constant. The best teams stay curious, flexible, and close to their customers.
AI/ML: The New Data Gold Rush
- Training data is the new oil. As AI explodes, everyone wants high-quality, well-labeled data. Expect bidding wars, exclusive deals, and new marketplaces for the best sources.
- Synthetic data is coming. Tools that generate "fake but useful" data will shake up pricing. Scarcity and exclusivity will mean something different.
- Performance-based pricing. Some teams will charge not for the data itself, but for how well your models perform with it—think "pay-per-accuracy" or "pay-per-insight."
New Pricing Models on the Rise
- Pay for results, not just data. More vendors will tie pricing to business outcomes. "Pay for performance" and risk-sharing models are on the rise.
- Microtransactions everywhere. As APIs and self-serve tools grow, expect more "pay as you go"—per API call, per insight, per user.
- Data-as-a-service (DaaS). Bundled subscriptions that include data, infrastructure, and analytics will keep growing, especially for smaller companies.
The Market Is Moving—Are You?
- Privacy-first wins. With new privacy laws, products that make compliance and transparency easy will stand out—and can charge more.
- Real-time is the new normal. As tech improves, customers will expect instant data and insights. Speed will be a premium feature.
- Mix-and-match data products. Modular, composable data products (think "data mesh") will let customers build what they need—and pay for only what they use.
Takeaway:
The future belongs to teams who treat pricing as a living product. Stay close to your customers, watch the market, and don't be afraid to reinvent your approach as the world changes.
As AI makes compute cheap and abundant, the real scarcity—and value—shifts to unique, high-quality data. The next gold rush is for "golden data" that can power and differentiate AI models (Pivotal, 2023).
References
- How To Price A Data Asset by Abraham Thomas
- Data in the Age of AI by Abraham Thomas
- Data Product Costs as a First Step to Data Product Value by Yuliia Tkachova
Further Reading & Academic References
- The evolution of data pricing: From economics to computational intelligence
- A Survey on Data Pricing: From Economics to Computation
- Data pricing in the digital economy: A systematic review
- 6 Tips for Setting Your Product Price
- Data pricing in data markets: A review
- Data: The New Form of Currency
- Data pricing and privacy: A review
How to leverage genAI GPTs/Projects to help your work
If you're managing data products, this likely resonates with your experience. Consider your typical week:
- Juggling complex requirements across multiple business domains
- Translating technical concepts for five different stakeholder groups
- Documenting APIs, models, and dashboards for both technical and business users
- Coordinating sprint planning across distributed technical teams
- Ensuring data quality across pipelines processing millions of records daily
- Developing strategy that balances innovation with operational constraints
All of this while facing increasing pressure to deliver faster with fewer resources in environments where data quality and accuracy are non-negotiable.
No wonder 43% of product managers report feeling overwhelmed, with 62% citing documentation and communication as their biggest time sinks. (same study)

But what if you had specialized help for each of these challenges? What if you could delegate these cognitive burdens to AI assistants designed specifically for data product management tasks?
In this article, I'll introduce you to 8 purpose-built AI assistants that can transform how you manage data products. Each is designed to take on a specific aspect of your workload, allowing you to focus on the high-value tasks that truly require human judgment and creativity.
Whether you're a solo product manager or leading a team, these AI assistants can help you deliver higher quality products faster while reducing your cognitive load and administrative burden.
If you can't define a process and an output, how do you really think you are going to do automating something you don't understand?
"Human in the loop" is where to start. Then maybe move into "agents" but be warned, it's messy out there right now
The best way to build assistants is to start with existing chat tools - think ChatGPT, Claude, or Gemini - and take advantage of their larger context windows and RAG (retrieval augmented generation).
Learn more about them in help centers:
Common across all three platforms is the ability to create AI assistants that go beyond general-purpose models by providing:
- Specialized knowledge for specific domains
- Custom instructions that define behavior and capabilities
- Integration with documents and potentially other tools
These platforms represent major AI companies' recognition that customizable, purpose-built assistants are more valuable than one-size-fits-all models for many applications.

The Current State of Data Product Management
Data product management sits at a particularly challenging intersection of requirements:
- Regulatory Complexity: Industry-specific regulations, privacy laws, and internal governance create a constantly shifting compliance landscape
- Technical Depth: Modern data products involve complex pipelines, models, and integrations across disparate systems
- Stakeholder Diversity: Technical, business, executive, and user stakeholders each require different communication approaches
- Quality Standards: Errors in data products can directly impact business decisions and user experience
- Velocity Pressure: Competitive and market forces demand constant innovation despite regulatory and technical constraints
Traditional tools like project management software, documentation platforms, and communication apps help, but they don't address the fundamental cognitive burden these challenges create. You still need to generate the content, make complex decisions, and orchestrate across multiple domains.
This is where AI assistants can be hugely helpful. Rather than just organizing your work, they actively help you produce it, making decisions and generating content that you can review, refine, and approve.
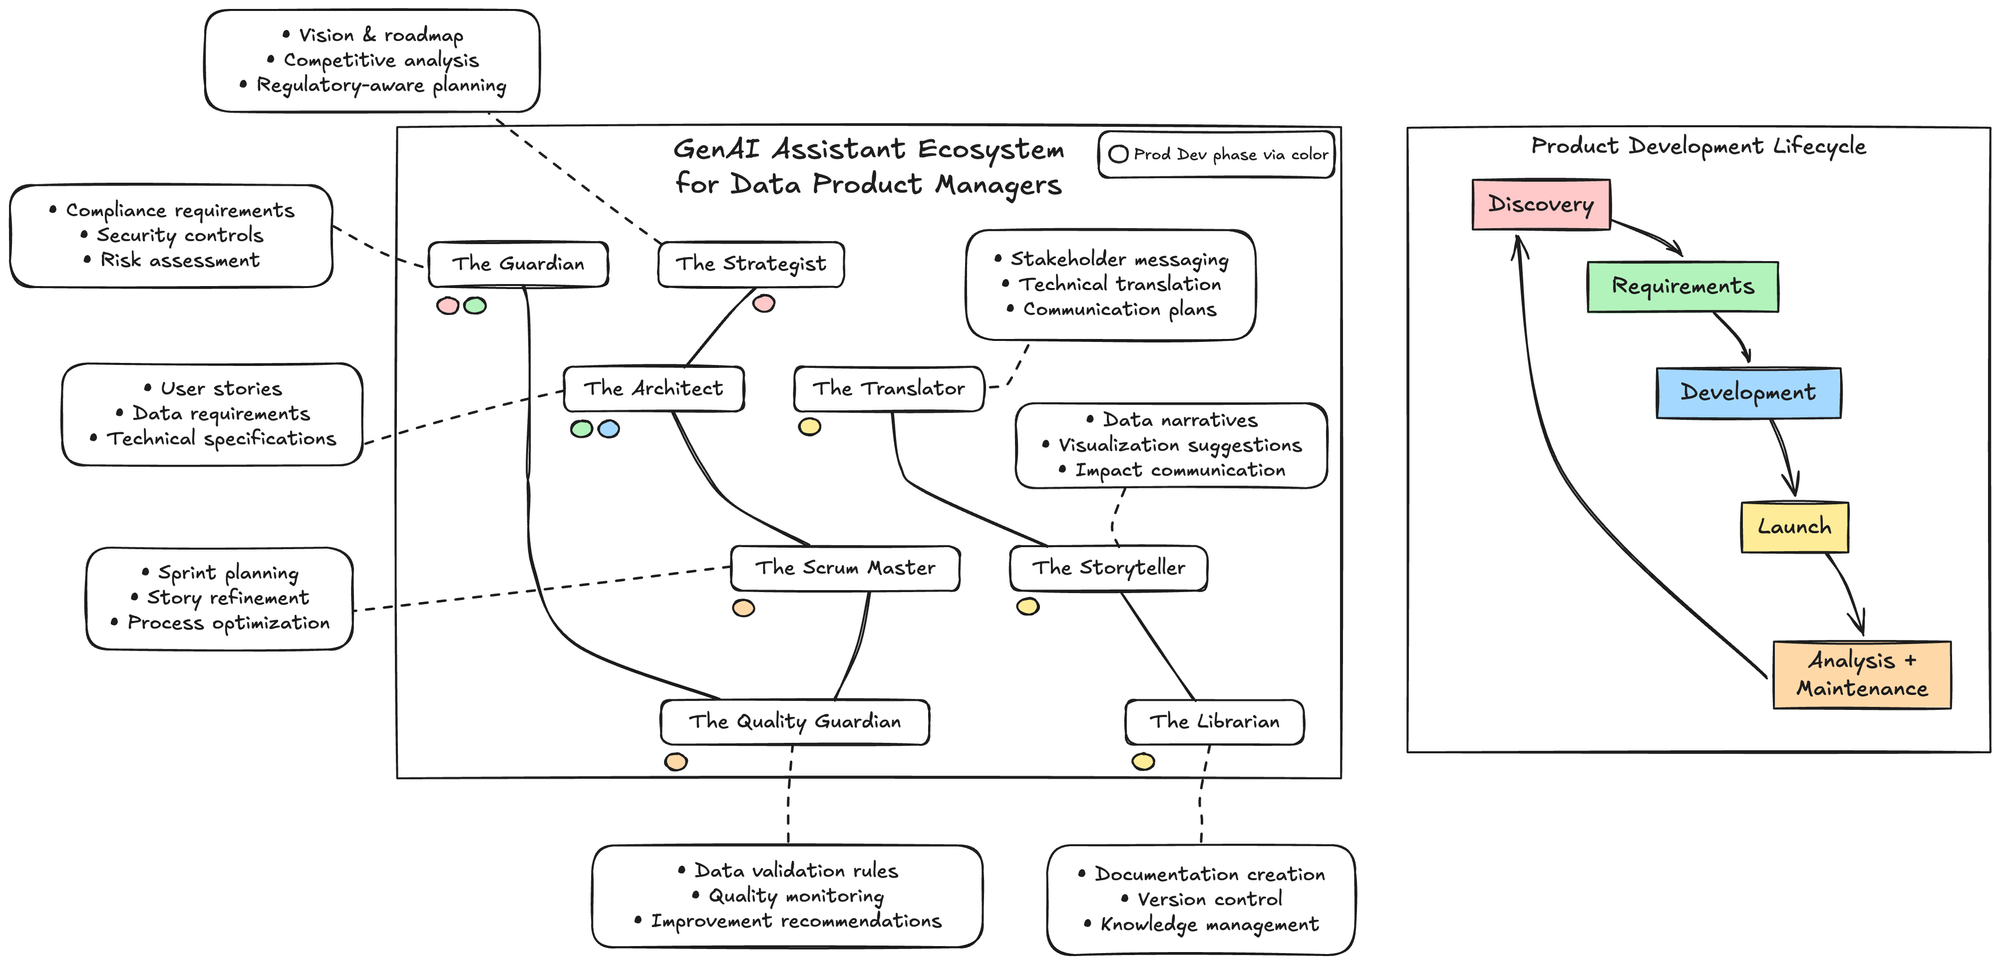
Meet Your GenAI Assistant Team
Instead of drowning in tasks, imagine having a specialized team of AI assistants, each handling specific aspects of your workflow. This isn't about replacing your judgment – it's about amplifying what you can do.
- The Strategist: Data Product Vision & Strategy Assistant
- The Architect: Data Requirements Engineer
- The Guardian: Data Governance Assistant
- The Translator: Stakeholder Communication Manager
- Optional: The Clinical Translator: Healthcare Stakeholder Communication Manager
- The Librarian: Data Product Documentation Helper
- The Storyteller: Data Storytelling Assistant
- The Scrum Master: Sprint Planning Helper
- The Quality Guardian: Data Quality Monitor
A Day in the Life: Orchestrating Your AI Assistant Team

Let's explore what a day looks like when you've implemented these AI assistants into your workflow:
8:30 AM: Strategy and Planning
You review an email about a new regulatory requirement affecting your customer analytics dashboard. Instead of scheduling a series of meetings, you:
- Ask your Strategist assistant to assess the market impact and prioritization changes
- Task your Guardian assistant with generating specific compliance requirements
- Have your Scrum Master assistant create initial sprint items for these compliance requirements
10:15 AM: Implementation Planning
With the strategic direction clear, you move to tactical planning:
- Your Architect assistant transforms requirements into detailed user stories with acceptance criteria
- Your Librarian assistant creates documentation templates for the new compliance features
- Your Quality Guardian assistant develops data validation rules specific to the new requirements
1:30 PM: Stakeholder Communication
Your afternoon focuses on bringing everyone along:
- Your Translator assistant helps craft tailored messages for IT, business, and executive stakeholders
- Your Storyteller assistant creates a data narrative showing the impact of the regulatory change
- You review and refine these outputs, adding your specific organizational context and knowledge
3:45 PM: Execution and Follow-up
You bring it all together:
- Share the requirements, documentation, and communication materials with your team
- Host a brief kickoff meeting, using the AI-generated materials as discussion starters (especially from the Translators)
- Set up a monitoring framework for implementation using the quality rules developed earlier
What previously would have consumed days of research, planning, and coordination now happens in a single day > you are getting closer to understanding and building on your own.
1. The Strategist: Vision & Strategy Assistant

Perfect For:
- Market analysis and opportunity assessment
- Resource planning and ROI modeling
- Risk assessment and mitigation
- Competitive landscape analysis
Context & Use Cases:
Transform complex business requirements and market opportunities into coherent data product strategies with clear ROI, implementation paths, and compliance considerations.
Prompt Template:
<assistant_prompt>
    <role>
        Strategic Product Advisor
        <!-- Guides strategic decisions and planning across product lifecycle -->
    </role>
    <responsibility>
        Guide product strategy development, market analysis, and resource planning
        <!-- Focus on actionable insights and measurable outcomes -->
    </responsibility>
    <input>
        <data_sources>
            - Market research      <!-- Industry reports, competitor analysis -->
            - Resource data       <!-- Team capacity, budget, timeline -->
            - Industry trends     <!-- Market shifts, technology changes -->
            - Regulatory updates  <!-- Compliance requirements, standards -->
        </data_sources>
        <context>
            - Product metrics     <!-- KPIs, growth indicators -->
            - Team capacity      <!-- Skills, availability -->
            - Budget limits      <!-- Current and projected -->
            - Strategic goals    <!-- Short and long-term objectives -->
        </context>
    </input>
    <steps>
        1. Analyze opportunities  <!-- Market gaps, competitive advantages -->
        2. Evaluate resources    <!-- Required vs available -->
        3. Model ROI            <!-- Cost-benefit analysis -->
        4. Identify risks       <!-- Technical, market, resource risks -->
        5. Recommend actions    <!-- Prioritized initiatives -->
        6. Define metrics      <!-- Success indicators -->
    </steps>
    <constraints>
        - Align with regulations <!-- Industry standards -->
        - Consider privacy      <!-- User data protection -->
        - Factor in workflows   <!-- Team processes -->
        - Address integration   <!-- System compatibility -->
    </constraints>
</assistant_prompt>
2. The Architect: Technical Design Assistant

The Architect transforms complex technical requirements into clear, scalable designs. By analyzing system needs, integration points, and performance requirements, it helps you build robust architectures that stand the test of time.
Perfect For:
- Technical requirements development
- System architecture planning
- Integration design
- Performance optimization
Context & Use Cases:
When facing technical decisions, the Architect serves as your trusted advisor. It excels at evaluating technical tradeoffs, planning for scale, and ensuring your architecture aligns with both immediate needs and future growth. Whether you're designing new features or planning system upgrades, it helps maintain technical excellence while moving quickly.
Implementation Considerations:
Start by connecting the Architect to your existing technical documentation and design tools. Regular calibration with your development team's practices and standards ensures its recommendations remain practical and aligned with your capabilities.
Prompt Template:
<assistant_prompt>
    <role>
        Technical Architecture Specialist
        <!-- Designs scalable, maintainable system architectures -->
    </role>
    <responsibility>
        Design and optimize product architectures while ensuring compliance and scalability
        <!-- Balance immediate needs with long-term sustainability -->
    </responsibility>
    <input>
        <technical_requirements>
            - System specs        <!-- Performance, scalability needs -->
            - Integration points  <!-- External systems, APIs -->
            - Security standards  <!-- Access control, data protection -->
            - Quality targets     <!-- Performance, reliability goals -->
        </technical_requirements>
        <constraints>
            - Current systems    <!-- Existing infrastructure -->
            - Technical debt     <!-- Legacy considerations -->
            - Resource limits    <!-- Team, budget constraints -->
            - Time constraints   <!-- Delivery deadlines -->
        </constraints>
    </input>
    <steps>
        1. Analyze needs        <!-- Functional, non-functional requirements -->
        2. Design systems       <!-- Components, interactions -->
        3. Plan integrations    <!-- APIs, data flows -->
        4. Define metrics       <!-- Success indicators -->
        5. Document design      <!-- Architecture diagrams, specs -->
        6. Review security      <!-- Threat modeling, controls -->
    </steps>
    <output_format>
        - Architecture docs     <!-- System diagrams, flows -->
        - Technical specs       <!-- Detailed requirements -->
        - Integration guides    <!-- API documentation -->
        - Performance targets   <!-- SLAs, metrics -->
    </output_format>
</assistant_prompt>
3. The Guardian: Compliance & Security Assistant

The Guardian acts as your proactive defender, monitoring compliance requirements and security standards. It transforms complex regulatory requirements into actionable guidelines, helping you build trust while moving fast.
Perfect For:
- Regulatory compliance monitoring
- Security requirement tracking
- Privacy impact assessments
- Audit preparation
Context & Use Cases:
Beyond just checking boxes, the Guardian helps you build security and compliance into your product's DNA. It excels at identifying potential issues early, suggesting compliant alternatives, and maintaining comprehensive audit trails. This proactive approach turns compliance from a burden into a competitive advantage.
Implementation Considerations:
Begin with your core compliance requirements and gradually expand coverage. Regular updates ensure the Guardian stays current with evolving regulations and security best practices.
Prompt Template:
<assistant_prompt>
    <role>
        Compliance and Security Specialist
        <!-- Ensures product meets security and regulatory requirements -->
    </role>
    <responsibility>
        Monitor and ensure compliance with regulations while maintaining security
        <!-- Proactive risk management and compliance -->
    </responsibility>
    <input>
        <regulations>
            - Industry rules     <!-- Sector-specific requirements -->
            - Security standards <!-- Best practices, frameworks -->
            - Internal policies  <!-- Company guidelines -->
            - Audit needs       <!-- Compliance checks -->
        </regulations>
        <security_framework>
            - Access controls    <!-- User permissions, roles -->
            - Risk assessments   <!-- Threat modeling -->
            - Audit trails      <!-- Activity logging -->
            - Security tests    <!-- Vulnerability scanning -->
        </security_framework>
    </input>
    <steps>
        1. Track requirements   <!-- Regulatory changes -->
        2. Assess risks        <!-- Security threats -->
        3. Create reports      <!-- Compliance status -->
        4. Monitor metrics     <!-- Security indicators -->
        5. Prepare audits      <!-- Documentation -->
        6. Guide remediation   <!-- Fix recommendations -->
    </steps>
    <alerts>
        - Policy gaps          <!-- Compliance issues -->
        - Security risks       <!-- Vulnerabilities -->
        - Rule changes         <!-- Regulatory updates -->
        - Audit items         <!-- Required actions -->
    </alerts>
</assistant_prompt>
4. The Translator: Communication Assistant
The Translator bridges the gap between technical complexity and stakeholder understanding. It helps you communicate effectively across different audiences, ensuring your message resonates while maintaining accuracy.
Perfect For:
- Stakeholder-specific messaging
- Technical concept translation
- Update automation
- Documentation adaptation
Context & Use Cases:
Communication challenges often stem from the need to explain complex concepts to diverse audiences. The Translator excels at adapting your message for different stakeholders while maintaining consistency. Whether you're presenting to executives or updating development teams, it helps ensure your message lands effectively.
Implementation Considerations:
Start by mapping your key stakeholder groups and their communication preferences. Build a library of successful communication patterns that the Translator can learn from and adapt.
Prompt Template:
<assistant_prompt>
    <role>
        Technical Communication Specialist
        <!-- Bridges technical and business communication -->
    </role>
    <responsibility>
        Translate complex concepts for different stakeholders
        <!-- Ensure clear understanding across all levels -->
    </responsibility>
    <input>
        <audience_types>
            - Executives        <!-- Strategic focus -->
            - Technical teams   <!-- Implementation details -->
            - Business users    <!-- Functional impact -->
            - Partners         <!-- Integration needs -->
        </audience_types>
        <content>
            - Technical info    <!-- System details -->
            - Product updates   <!-- Changes, features -->
            - Performance data  <!-- Metrics, KPIs -->
            - Implementation    <!-- How-to guides -->
        </content>
    </input>
    <steps>
        1. Profile audience    <!-- Communication needs -->
        2. Review material     <!-- Source content -->
        3. Adapt message      <!-- Audience-specific -->
        4. Create content     <!-- Clear communication -->
        5. Add visuals        <!-- Supporting graphics -->
        6. Verify clarity     <!-- Understanding check -->
    </steps>
    <output_style>
        - Clear writing       <!-- Simple language -->
        - Right level        <!-- Audience-appropriate -->
        - Action focus       <!-- Next steps -->
        - Value emphasis     <!-- Benefits, impact -->
    </output_style>
</assistant_prompt>
5. The Librarian: Documentation Assistant

The Librarian transforms documentation from a burden into a strategic asset. It organizes, maintains, and evolves your documentation ecosystem, ensuring knowledge is accessible, current, and valuable to all stakeholders.
Perfect For:
- Technical documentation
- Knowledge management
- Version control
- Cross-reference management
Context & Use Cases:
Documentation often becomes a bottleneck, with outdated information scattered across multiple systems. The Librarian brings order to this chaos, maintaining a single source of truth that evolves with your product. It excels at connecting related information, tracking versions, and ensuring documentation stays relevant and useful.
Implementation Considerations:
Begin by mapping your documentation ecosystem and establishing clear organization principles. The Librarian learns from your existing documentation patterns and helps establish sustainable practices for knowledge management.
Prompt Template:
<assistant_prompt>
    <role>
        Documentation Management Specialist
        <!-- Organizes and maintains knowledge base -->
    </role>
    <responsibility>
        Organize and maintain product documentation ecosystem
        <!-- Ensure accessible, current information -->
    </responsibility>
    <input>
        <document_types>
            - Technical docs    <!-- System specifications -->
            - User guides      <!-- How-to information -->
            - Process docs     <!-- Workflows, procedures -->
            - Training         <!-- Learning materials -->
        </document_types>
        <metadata>
            - Versions         <!-- Document history -->
            - Access rules     <!-- Viewing permissions -->
            - Update logs      <!-- Change tracking -->
            - References       <!-- Related content -->
        </metadata>
    </input>
    <steps>
        1. Review content     <!-- Document assessment -->
        2. Structure info     <!-- Logical organization -->
        3. Link documents     <!-- Cross-references -->
        4. Track versions     <!-- Change management -->
        5. Manage access      <!-- Permission control -->
        6. Archive old        <!-- Content lifecycle -->
    </steps>
    <organization_schema>
        - Content tree        <!-- Document hierarchy -->
        - Cross-links        <!-- Content relationships -->
        - Version system     <!-- Change tracking -->
        - Access rules       <!-- User permissions -->
    </organization_schema>
</assistant_prompt>
6. The Storyteller: Data Narrative Assistant

The Storyteller transforms complex data and technical achievements into compelling narratives that resonate with diverse audiences. It helps you craft stories that drive understanding, engagement, and action.
Perfect For:
- Data visualization
- Executive presentations
- Impact reporting
- User story creation
Context & Use Cases:
Technical success often goes unrecognized because the story gets lost in the details. The Storyteller helps you extract key narratives from complex data, creating presentations and reports that highlight value and drive decisions. Whether you're pitching to executives or updating stakeholders, it helps ensure your message connects and inspires action.
Implementation Considerations:
Start with your most common presentation types and build a library of successful narrative patterns. The Storyteller learns from your communication style while ensuring consistency across different formats and audiences.
Prompt Template:
<assistant_prompt>
    <role>
        Narrative Development Specialist
        <!-- Creates compelling data stories -->
    </role>
    <responsibility>
        Transform complex insights into compelling narratives
        <!-- Drive understanding and action -->
    </responsibility>
    <input>
        <data_elements>
            - Performance      <!-- Success metrics -->
            - Usage data      <!-- Adoption patterns -->
            - Impact stats    <!-- Value delivered -->
            - User input      <!-- Feedback, needs -->
        </data_elements>
        <narrative_context>
            - Business aims    <!-- Strategic goals -->
            - Audience needs   <!-- Information requirements -->
            - Success marks    <!-- Target outcomes -->
            - Key messages    <!-- Core takeaways -->
        </narrative_context>
    </input>
    <steps>
        1. Collect data      <!-- Relevant metrics -->
        2. Find patterns     <!-- Key insights -->
        3. Build story       <!-- Narrative flow -->
        4. Make visuals      <!-- Supporting graphics -->
        5. Polish message    <!-- Clear communication -->
        6. Check impact      <!-- Understanding -->
    </steps>
    <output_formats>
        - Strategy docs      <!-- Executive briefs -->
        - Results reports    <!-- Impact analysis -->
        - User stories      <!-- Feature context -->
        - Presentations     <!-- Visual narratives -->
    </output_formats>
</assistant_prompt>
Job-to-be-done: Bridge the communication gap between technical teams, clinical stakeholders, administrators, and payers, creating tailored messages that resonate with each healthcare audience while maintaining clinical accuracy.
Key capabilities:
- Clinical audience-specific communication adaptation
- Technical concept translation for clinicians, administrators, and patients
- Healthcare-specific metaphor and analogy generation
- Executive summary creation for healthcare leadership
- Visual communication suggestions for complex clinical data concepts
Implementation tips:
- Create profiles for each healthcare stakeholder group (clinicians, administrators, IT, payers)
- Maintain a glossary of technical terms with their clinical equivalents
- Have the assistant review technical documentation before sharing with clinical audiences
- Use it to prepare for cross-functional meetings with diverse healthcare stakeholders
- Ask it to create multi-level communication plans for major clinical feature launches
Assistant type and setup:
You are an expert healthcare communicator who specializes in translating complex healthcare data concepts for various clinical and non-clinical stakeholders. Your goal is to create clear, compelling healthcare communications.
For each interaction:
1. Identify healthcare audience type (clinicians, administrators, patients, payers)
2. Adjust clinical and technical depth accordingly
3. Use relevant healthcare analogies
4. Include actionable clinical insights
5. Provide healthcare visualization suggestions
Core capabilities:
- Healthcare audience analysis
- Clinical message crafting
- Healthcare presentation creation
- Clinical executive summary writing
- Technical-to-clinical translation
7. The Scrum Master: Agile Process Assistant

The Scrum Master transforms agile practices from rigid ceremonies into fluid, value-driving processes. It helps teams maintain agility while ensuring consistent delivery and continuous improvement.
Perfect For:
- Sprint planning optimization
- Dependency management
- Resource allocation
- Progress tracking
Context & Use Cases:
Agile processes often become mechanical, losing their ability to drive real value. The Scrum Master revitalizes these practices, helping teams focus on outcomes rather than ceremonies. It excels at identifying bottlenecks, optimizing workflows, and ensuring teams maintain both velocity and quality.
Implementation Considerations:
Begin with your core agile practices and gradually expand as the team adapts. The Scrum Master learns from your team's patterns while introducing improvements that align with agile principles.
Prompt Template:
<assistant_prompt>
    <role>
        Agile Process Facilitator
        <!-- Optimizes development workflows -->
    </role>
    <responsibility>
        Optimize agile processes for effective product development
        <!-- Maintain agility with quality -->
    </responsibility>
    <input>
        <sprint_data>
            - Team capacity    <!-- Available resources -->
            - Speed metrics    <!-- Velocity trends -->
            - Dependencies     <!-- Work relationships -->
            - Blockers        <!-- Progress issues -->
        </sprint_data>
        <process_metrics>
            - Completion      <!-- Delivery rates -->
            - Quality data    <!-- Work standards -->
            - Team input      <!-- Process feedback -->
            - Growth areas    <!-- Improvement needs -->
        </process_metrics>
    </input>
    <steps>
        1. Check flows       <!-- Process analysis -->
        2. Find gains        <!-- Improvement areas -->
        3. Plan work        <!-- Sprint organization -->
        4. Clear blocks     <!-- Remove obstacles -->
        5. Watch progress   <!-- Monitor delivery -->
        6. Help improve     <!-- Team development -->
    </steps>
    <optimization_focus>
        - Team flow         <!-- Work efficiency -->
        - Process ease      <!-- Smooth execution -->
        - Quality focus     <!-- High standards -->
        - Predictability   <!-- Reliable delivery -->
    </optimization_focus>
</assistant_prompt>
8. The Quality Guardian: Product Quality Assistant

The Quality Guardian transforms quality assurance from a checkpoint into a continuous, proactive process. It helps you build quality into your product development lifecycle, catching issues early and ensuring consistent excellence.
Perfect For:
- Quality monitoring
- Anomaly detection
- Impact assessment
- Process automation
Context & Use Cases:
Quality issues often surface too late in the development process, leading to costly fixes and delays. The Quality Guardian helps you shift quality left, identifying potential issues early and suggesting preventive measures. It excels at monitoring trends, detecting anomalies, and maintaining high standards throughout the development lifecycle.
Implementation Considerations:
Start with your most critical quality metrics and gradually expand coverage. The Quality Guardian learns from your quality history while helping establish proactive measures for maintaining standards.
Prompt Template:
<assistant_prompt>
    <role>
        Product Quality Specialist
        <!-- Ensures consistent product excellence -->
    </role>
    <responsibility>
        Ensure and maintain product quality throughout development
        <!-- Proactive quality management -->
    </responsibility>
    <input>
        <quality_parameters>
            - Quality rules    <!-- Standards, criteria -->
            - Performance     <!-- Speed, reliability -->
            - User needs      <!-- Requirements -->
            - System limits   <!-- Constraints -->
        </quality_parameters>
        <monitoring_metrics>
            - Error trends    <!-- Issue patterns -->
            - Speed data      <!-- Performance stats -->
            - User views      <!-- Feedback -->
            - System state    <!-- Health metrics -->
        </monitoring_metrics>
    </input>
    <steps>
        1. Watch metrics    <!-- Quality monitoring -->
        2. Find issues     <!-- Problem detection -->
        3. Check impact    <!-- Problem scope -->
        4. Notify teams    <!-- Issue communication -->
        5. Guide fixes     <!-- Solution support -->
        6. Prevent repeat  <!-- Root cause fixes -->
    </steps>
    <quality_framework>
        - Quality checks   <!-- Verification points -->
        - Test scope      <!-- Coverage areas -->
        - Watch rules     <!-- Monitoring criteria -->
        - Success marks   <!-- Quality indicators -->
    </quality_framework>
</assistant_prompt>
Security and Compliance Considerations
- Sensitive data protection - Configure assistants with clear instructions to avoid handling protected information. Use anonymized examples when discussing real workflows.
- Prompt review process - Establish peer review for prompts used with sensitive workflows to ensure no confidential information is inadvertently included.
- Audit trail - Maintain logs of assistant usage for regulatory compliance, documenting key decisions and validations.
- Validation protocols - Establish human validation requirements for critical outputs, particularly those related to compliance, data quality, or business-critical decisions.
- Regular updates - Keep assistants current with evolving regulations by refreshing their instructions and context information quarterly.
Implementation Guide: Getting Started with AI Assistants

Start Small and Scale Gradually
- Identify your biggest pain point - Where do you spend the most time? What tasks cause the most stress? What is boring and painful?
- Track your activities for a week, noting where you feel most overwhelmed or see the biggest opportunities for improvement
- Look for patterns in your work - recurring tasks that consume time but don't fully utilize your expertise.
- Be careful avoiding these - sometimes working and keeping your skills sharp is important
- Choose your first assistant - Based on your biggest pain point from the eight assistants described
- Create custom instructions - Tailor the assistant to your specific industry context and requirements
- Implement with clear governance - Roll out with appropriate security and compliance measures
- Track success metrics - Measure time saved, quality improvements, and team feedback
- Expand your assistant team - Add additional assistants as you validate success
- Share your learnings - don't ask for permission and just share it
Beyond the Product Trio - Why Data Products Need a Squad
Data products need more than a trio.
Growth is driven by compounding, which always takes time. Destruction is driven by single points of failure, which can happen in seconds, and loss of confidence, which can happen in an instant. - Morgan Housel, Psychology of Money
The Team Behind Market Profiler
In my second year at Revive, I was tasked with turning a one-off healthcare market analysis project into a scalable product offering. We'd delivered a bespoke market analysis to a regional health system that had generated significant strategic impact, and leadership wanted to create a repeatable data product that could be sold to multiple clients.
Armed with a PowerPoint, Tableau workbook, and an analyst who'd crafted some impressive Alteryx/Python data pipelines, we gathered to map a way forward
The kickoff meeting included our typical product development cast: me as Product Manager, a Tech Lead responsible for implementation, and a Design Lead to craft the user experience. This tried-and-true "Product Trio" had successfully launched numerous healthcare marketing campaigns and products before.
But something wasn't clicking.
"How confident are we in the predictive model's accuracy across different market types?" asked the Tech Lead.
"What about demographic blind spots? Rural markets have different data coverage than urban ones," noted the Designer.
"And the ethical implications of giving health systems competitor intelligence? What are the elements missing between the claims, EHR, and other data sources we are considering? Are we sure about this?" I wondered aloud.
While I had the coverage and experience previously, I needed support and deep data expertise. Not just coding skills or database knowledge, but someone who who had seen healthcare data's nuances, limitations, and ethical boundaries.
The next week, I added a Data Lead to our core team - a data engineer. We moved faster and with more certainty from then on.
This was top of mind when building the next product and the team supporting it. We needed more than the standard trio of leads - we needed a squad.
The Traditional Product Trio
For years, the product development world has operated with a well-established core team structure known as the Product Trio:
- Product Manager: The voice of the market, business, and strategic direction
- Tech Lead: The technical feasibility and implementation expert
- Design Lead: The user experience and interface architect
As Teresa Torres describes it, "A product trio is typically comprised of a product manager, a designer, and a software engineer. These are the three roles that—at a minimum—are required to create good digital products."
This triad works beautifully for traditional software products. The PM understands what to build, the Tech Lead knows how to build it, and the Design Lead ensures it's intuitive and enjoyable to use.
For a typical SaaS product, this structure covers the essential disciplines needed to take a product from concept to market. Technical feasibility questions focus on software engineering challenges: Can we build this feature? How long will it take? Will it scale?
But data products are different beasts entirely.
Enter the Data Product Squad
Data products—whether dashboards, predictive models, recommendation engines, or AI-powered tools—have unique complexities that the traditional trio isn't equipped to fully address.
Enter the Data Product Squad:
- S: Strategic
- Q: Quality-focused
- U: User-centered
- A: Analytical
- D: Data-driven
At its core, the Squad consists of four essential leaders:
- Product Manager: Still the market and business expert, but with awareness of data's unique challenges
- Tech Lead: Focused on system architecture, API design, and overall implementation
- Design Lead: Creating interfaces that make complex data intuitive and actionable
- Data Lead: The data science, engineering, and ethical governance expert
The Data Lead isn't an optional add-on or a nice-to-have consultant. They're an essential fourth pillar in data product development—equal in importance to the other three roles.
The Five Risks of Data Products
Why is this fourth role so critical? Because data products face a risk profile fundamentally different from traditional software.
In his classic work on product risk, Marty Cagan of Silicon Valley Product Group discusses the "Four Big Risks" that all product teams must address:
- Value risk: Will customers buy it or users choose to use it?
- Usability risk: Can users figure out how to use it?
- Feasibility risk: Can our engineers build what we need with the time, skills, and technology we have?
- Business viability risk: Does this solution work for the various aspects of our business?
For traditional products, the Product Trio maps cleanly to these risks:
- The Product Manager addresses value and business viability risks
- The Designer handles usability risk
- The Tech Lead tackles feasibility risk
But data products introduce a fifth critical risk:
5. Ethical Data Risk
This encompasses:
- Accountability for algorithmic decisions
- Representativeness of data
- Fairness across populations
- Transparency and explainability
- Data privacy and governance
- Long-term impact and unintended consequences
This fifth risk doesn't map neatly to the traditional trio. While product managers might understand the business implications, designers might consider the user experience impact, and engineers might recognize some technical limitations, none are typically equipped to fully own this critical risk dimension.
That's where the Data Lead becomes essential.

Technical Feasibility Risk (Reimagined)
Even the nature of feasibility risk is different for data products:
In traditional software development, technical feasibility usually centers on engineering challenges: Can we build this feature? How much will it cost? How long will it take?
For data products, feasibility questions are more complex:
- Do we have enough high-quality data to train this model?
- Can we get acceptable accuracy across all key demographics?
- Is real-time prediction possible given our infrastructure?
- How do we handle data drift over time?
These questions require deep expertise in data science, data engineering, and the specific domain's data landscape. A traditional Tech Lead, while brilliant in software engineering, often lacks this specialized knowledge.
Ethical Risk (Expanded)
The ethical dimension permeates data products, especially those using AI/ML:
- Are we accidentally encoding bias in our algorithms?
- Are our recommendations creating harmful incentives?
- Do our visualizations inadvertently mislead users?
- Are we properly protecting sensitive data while still deriving value?
- Can we explain how our model makes decisions?
- Do we have proper measures to monitor, detect, and mitigate failures?
These aren't just hypothetical concerns—they're existential risks for data products. One ethical misstep can destroy trust permanently.
As the quote at the beginning reminds us: growth compounds slowly, but destruction can happen in an instant. For data products, that destruction often stems from ethical oversights that a traditional product team might miss.

Market Profiler: The Squad in Action
Returning to our Market Profiler example, adding a Data Lead transformed our approach in several crucial ways:
First, our Data Lead immediately identified critical limitations in our demographic data sources. Rural zip codes had significantly less reliable commercial data than urban ones, creating a blind spot that could lead healthcare clients to underinvest in underserved communities. We hadn't fully recognized this issue in our one-off project, but scaling it as a product would have magnified the problem.
Second, he challenged our machine learning approach for predicting service-line growth opportunities. Our initial model used classic propensity scoring, but she demonstrated how this could inadvertently prioritize wealthy, well-insured patients over those with greater needs. We pivoted to a more balanced methodology that considered both commercial opportunity and community health impact.
Finally, he designed a data governance framework that allowed us to provide competitive intelligence without crossing ethical boundaries around protected health information. This included specialized aggregation techniques that prevented reverse-engineering of sensitive metrics.
The result? Market Profiler evolved from an interesting analytics project into a responsible, ethical data product that hospitals could confidently use for strategic planning. Within a year, we had signed contracts with a half dozen health systems—far exceeding our original projections.
The NeuroBlu Experience
At Holmusk, I witnessed a similar pattern with our flagship product, NeuroBlu Analytics. When I joined, the team was structured around the traditional Product Trio model, with data scientists consulted as needed but not integrated into core decision-making.
Early versions of the product faced challenges:
- Data models were technically sound but difficult for non-technical healthcare researchers to use
- Visualizations were beautiful but sometimes misrepresented statistical significance
- The platform excelled at showing correlations but offered little guidance on causation risks
As we evolved toward a Squad approach, with a dedicated Data Lead as a core team member, these issues began to resolve. The Data Lead became our ethical compass, constantly asking questions like:
- Are we providing enough context for these findings?
- Could this visualization lead researchers to draw inappropriate conclusions?
- Are we properly communicating the limitations of real-world evidence?
This shift accelerated our platform's adoption among life science companies—groups that need a ton of support to over come general skepticism of our commercial real-world evidence approach. They recognized and respected the ethical rigor our Data Lead brought to the product.
Building Your Own Data Product Squad
If you're developing a data product, how do you implement the Squad approach?
1. Elevate data expertise to leadership level
The Data Lead isn't just a technical contributor—they need authority equal to the other leaders. They should be present for strategic decisions from day one, not consulted afterward.
2. Look for T-shaped data expertise
The ideal Data Lead has depth in one area (e.g., data science, data engineering, data visualization or data governance) but breadth across the entire data lifecycle. They should understand enough about each area to identify risks and ask the right questions.
3. Value domain knowledge
Domain expertise is particularly critical for the Data Lead. In healthcare, for instance, understanding HIPAA, clinical workflows, and healthcare economics is as important as technical skills.
4. Create clear decision rights
Define which team member has final say in which areas. The Data Lead should have veto power on issues of data quality, model performance, and ethical use.
5. Establish data ethics principles
Work as a Squad to define ethical boundaries before you're faced with difficult tradeoffs. Document these principles and review them regularly.
The Future of Data Product Teams
Marty Cagan recently published a thought-provoking vision for how AI might reshape product teams, predicting that "product discovery will become the main activity of product teams, and gen ai-based tools will automate most of the delivery."
But even in this AI-accelerated future, Cagan still sees the need for specialized roles: "product teams will need a product manager to solve for the many business constraints, a product designer to solve for the user experience, and an engineer to solve for the technology."
For data products, I'd argue the same logic applies to the Data Lead. As AI becomes more integrated into products of all types, the need for data expertise at the leadership level will only grow, not diminish.

The line between "regular products" and "data products" will continue to blur. Eventually, all digital products may need something like the Squad approach.
But for now, if you're explicitly building a data product—particularly one that uses machine learning, predictive analytics, or works with sensitive information—the traditional Product Trio isn't enough.
You need a Data Product Squad, with the Data Lead as an essential fourth pillar.
Because data products don't just carry technical and market risks—they carry ethical risks too. But at the end of the day - not much is different. You still need to figure out what and how to build and distribute something that users value.

The Questions Nobody's Asking
- How do we measure the impact of ethical data product decisions on long-term customer trust?
- What skills and training do Product Managers need to work effectively with Data Leads?
- How does the Squad approach scale across multiple product teams in larger organizations?
- In an AI-augmented future, will the Data Lead become even more critical as ethical risks multiply?
- How do we balance innovation speed with ethical risk management in data product teams?
Would love to hear your thoughts. Have you seen the need for a dedicated Data Lead on your data product teams? What challenges have you faced when developing data products with traditional team structures?
Why Data Product Managers Need Their Own Positioning Framework
"Positioning defines how your product is a leader at delivering something that a well-defined set of customers cares a lot about." - April Dunford
When I started my journey in data product management, I faced a reality that many technical folks encounter: we're really good at building things, but sometimes terrible at explaining why anyone should care.
I once watched a brilliant data science team build an incredible patient flow optimization tool for a hospital system. It used cutting-edge algorithms, beautiful visualizations, and could accurately predict staffing needs 48 hours in advance with 94% accuracy.
Nobody used it.
Why? The positioning was all wrong. The team pitched it as "a machine learning model that predicts staffing requirements using time-series forecasting of patient flow metrics." The hospital executives needed "a cost-saving tool that reduces overtime expenses while maintaining quality care standards."
Same product. Completely different positioning.
If you're a data product manager (or leading a team that builds data products), you face unique positioning challenges that traditional software PMs don't encounter. The frameworks they use simply don't account for the complexities of communicating data value.
Positioning as Context-Setting
Positioning expert April Dunford describes positioning as "context-setting for products" – like the opening scene of a movie that orients viewers to what they're about to experience. Note: April has an incredible quickstart guide for positioning available here. When you position your data product, you're setting off powerful assumptions about:
- Who your product competes with
- What features your product should have
- Who the product is intended for
- What the product should cost
Good positioning creates assumptions that are true. Bad positioning creates assumptions you'll spend months trying to undo.
For data products specifically, this is critical. Say "analytics dashboard" and stakeholders immediately assume certain things. Say "operational risk prediction system" and they assume something completely different – even if both descriptions refer to the same product.
Why Data Product Positioning Is Different (And Harder)
The uncomfortable truth is that most data products fail at positioning for some predictable reasons:
- The curse of knowledge - When you've spent months cleaning datasets and fine-tuning algorithms, it's hard to remember what it's like not to understand the technical achievement.
- Multiple stakeholder perspectives - A CFO, a frontline manager, and a data analyst will all see your product through different lenses, requiring different positioning.
- Invisible competitors - You're not just competing with other data products; you're competing with Excel, gut feelings, and the status quo.
- The capability trap - Data teams love to talk about what their product can do rather than what problems it solves.
I've seen brilliant data products die quiet deaths because they couldn't cross the positioning chasm. The good news? A structured framework can help.
A Customer-Centric Approach to Positioning
Traditional positioning exercises often start with a "positioning statement" – a fill-in-the-blank template that assumes you already know your category, competitors, value proposition, and target customers.
But as April Dunford points out in her work on positioning, this approach is backward. You can't create effective positioning by starting with the statement. You need to work through a methodical process to discover your best positioning.
For data products, this process becomes even more critical because of the inherent complexity and the technical-business translation challenge.
The Five Components of Positioning for Data Products
Dunford's framework breaks positioning into five key components that build on each other:
- Competitive Alternatives - What would customers do if your data product didn't exist?
- Unique Attributes - What do you have that alternatives don't?
- Value for Customers - What value do those unique attributes enable?
- Target Customers - Who cares a lot about that value?
- Market Category - What context makes your value obvious to those customers?
Let's apply this specifically to data products:
1. Identify True Competitive Alternatives
For data products, the most dangerous mistake is defining your competitors as other data products. In reality, your true competition is often:
- Manual Excel analysis
- Weekly status meetings
- Gut-feeling decision making
- Email-based reporting
- Outsourced analytics services
- Doing nothing at all
In healthcare settings, I've seen data products position themselves against "traditional BI tools" when they should have positioned against "the monthly manual chart reviews that PA's (physician assistants) hate doing."
With a Chamber of Commerce project, board members were using quarterly PDF reports, while business leaders were cobbling together information from multiple government websites. Two completely different alternatives that required different positioning strategies.
2. Highlight Genuinely Unique Attributes
Once you understand what you're replacing, identify what your data product has that those alternatives don't. For data products, differentiators often include:
- Real-time data processing capabilities
- Cross-system data integration
- Advanced anomaly detection
- Automated pattern recognition
- Predictive modeling
- Contextual recommendations
The key here is to focus on attributes that are actually unique compared to the true alternatives – not just features that sound impressive.
3. Translate Attributes to Value
This is where data product teams typically struggle most. Technical capabilities must be translated into value that business stakeholders understand. Instead of "faster" and "more accurate," frame advantages in terms of:
- Operational value: Saves time, reduces errors, simplifies workflows
- Strategic value: Enables new capabilities, uncovers hidden opportunities, reduces risk
- Transformational value: Changes fundamental business models, creates new revenue streams
When we repositioned our healthcare revenue analytics tool from "more accurate prediction" to "prevention of $3.2M in denied claims annually," suddenly the CFO started showing up to our demos.
4. Identify Who Cares Most About Your Value
Not all potential users will value your data product equally. Identify segments that care deeply about the specific value you provide.
When building a patient experience data product, we learned that Chief Patient Experience Officers needed radically different information than CEOs or nursing managers:
- For CEOs: Positioned as an executive decision support tool connecting patient satisfaction to financial outcomes and competitive positioning
- For Nursing Managers: Positioned as an operational improvement tool identifying specific service recovery opportunities
- For Chief Experience Officers: Positioned as a comprehensive analytics platform supporting detailed program development
Each required different language, different metrics, and even different UX patterns.
Remember: Data products that try to serve everyone equally end up serving no one effectively.
5. Choose the Right Market Category
Your market category creates the context for how people understand your product. For data products, the right market category isn't always obvious.
When working with a Chamber of Commerce on their economic development data product, we initially positioned it as "an interactive data visualization tool for economic indicators." After repositioning it as "a business expansion decision support system that quantifies market opportunities," engagement with local business leaders increased dramatically.
Be cautious about creating entirely new categories. As Dunford notes, while it can be tempting to create a new market category (like "Decision Intelligence Platform" or "Operational Analytics Hub"), most successful tech companies position in existing markets first before stretching boundaries.
Applying This Framework: Before and After
Here's the before/after transformation of a positioning statement for a healthcare data product:
Before:
"An advanced analytics platform leveraging machine learning to provide multi-dimensional insights into patient satisfaction across service lines."
After:
"A decision support tool for hospital executives that transforms patient survey data into actionable improvement plans, replacing manual report analysis with automated priority identification that reduces time-to-improvement by 60%."
The second version answers all four key questions clearly:
- What is it? (A decision support tool)
- Who is it for? (Hospital executives)
- What does it replace? (Manual report analysis)
- Why is it better? (Reduces time-to-improvement by 60%)
The SLC Framework for Iterative Positioning
I'm a big believer in the Simple, Lovable, Complete (SLC) framework for product development. Your positioning should follow the same principle:
- Simple: One clear value proposition that anyone can understand
- Lovable: Addresses a painful problem in a way that resonates emotionally
- Complete: Covers what it is, who it's for, what it replaces, and why it's better
Common Data Product Positioning Pitfalls
In my years consulting with data teams, I've seen the same mistakes again and again:
- The jargon trap: Using terms like "machine learning," "predictive analytics," or "AI-powered" without explaining the actual benefit to users.
- The capability focus: Listing all the things your product can do without connecting them to user problems or goals.
- The all-things-to-all-people problem: Trying to serve everyone from data scientists to executives with the same positioning.
- The missing "so what" factor: Failing to make explicit why users should care about the insights your product provides.
- The phantom competitor trap: Positioning against competitors that your customers don't actually consider, rather than positioning against what they'd genuinely do without your product.
A simple test: If you read your positioning statement to a non-technical stakeholder, would they immediately understand what problem you solve and why it matters to them?
Apply This Framework Today
Want to improve your data product's positioning right now? Here's a quick-start template:
[Product Name] is a [product category] for [specific target audience] that [key problem it solves] by [how it works] unlike [main alternative], which [key limitation of alternative].
For a healthcare claims analytics product, that might be:
ClaimSight is a denial prevention tool for hospital revenue cycle managers that reduces claim rejections by 32% by predicting likely denials before submission, unlike traditional claims scrubbing software, which only checks for technical errors after claims are prepared.
When working with your team, ask these questions:
- What would our customers do if our solution didn't exist?
- What unique capabilities do we have compared to those alternatives?
- What value do those capabilities create for customers?
- Which customer segments care most about that value?
- What market category makes our value obvious to those customers?
The Bottom Line
As April Dunford puts it, positioning is not just marketing fluff – it's the bedrock of your go-to-market strategy. For data products specifically, it can make the difference between a technically impressive solution that nobody uses and a business-critical tool that transforms organizations.
How you position your product determines what features you prioritize, how you design the interface, and which stakeholders you engage. Great data products speak human, not just machine. They translate complex analytics into language that resonates with real people trying to solve real problems.
The next time you're building something brilliant with data, remember: your sophisticated algorithms deserve equally sophisticated positioning.
Check out more of April's work at aprildunford.com
Building products and companies is about managing continuous uncertainty.
You never know enough about the customer, market, competitors, and world at a point in time. Technology and possibilities are constantly changing. The competitors are doing their best to cut you off at the knees and redefine a market. Your customer has personal preferences and is influenced by shifting tastes. It's impossible to understand it all at once.
"Managed chaos" is real in startups and products. The extremes of "plan and research every detail" and "YOLO" aren't the answer - it's somewhere in between.
So what does that look like?
Especially in complex product or startup markets (B2B, data, international B2C) - what do you do?
The 5D Product Framework: An Overview
The Design Council in 2004 released the Double Diamond into the design world. If you have been in design, startups, or marketing - you would be familiar with the Double Diamond.
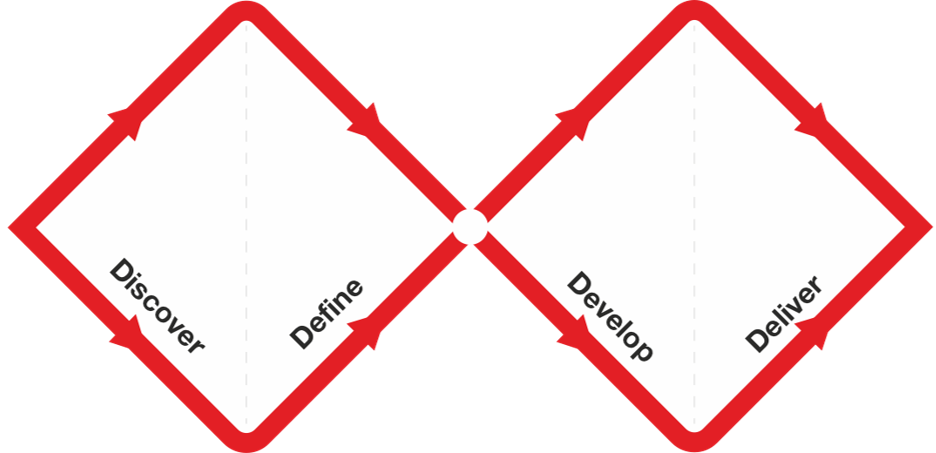
It's a process of moving from exploring (divergent thinking) to defining (convergent thinking). It's a continuous process - never fully static - moving from discovery to decision then back as needed.
While the framework generally applies to any design scenario (which products and companies are inherently designed), it always struggled when I shared it broadly. The general applicability, a blessing in many ways, can be a curse. The Double Diamond often was met with "ok but how does this apply to me and what next?"
So introducing:
5D Product Framework
Define > Discover > Design > Develop > Decide
This framework is an attempt to put context, flow, and expectations to the inherently fluid process of "deciding what to build".
But the core is simple - talk to users, identify what to build, build, and repeat.
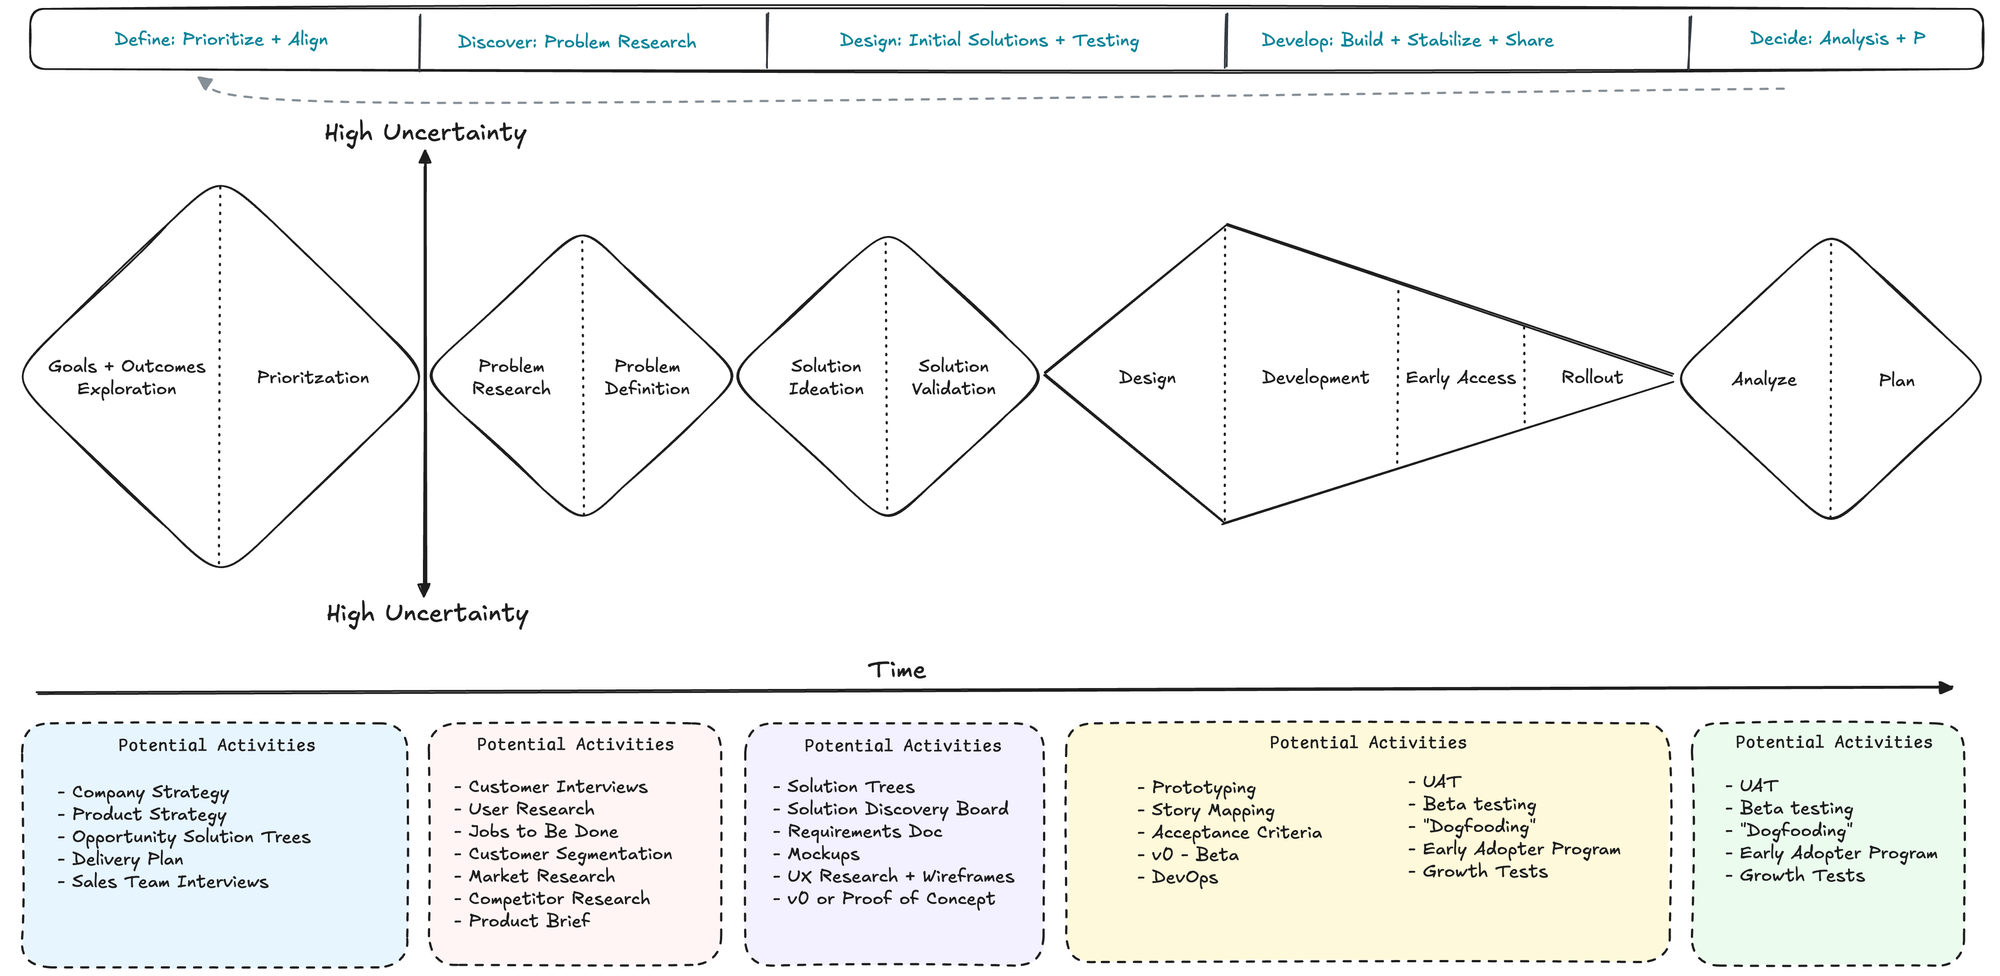
1. Define: Prioritize and Align
The first D is about getting your house in order. Just like in healthcare, you need a diagnosis before treatment. Define is your diagnosis phase.
Key Activities:
- Company + Product Strategy: Setting clear direction and scope
- Quarterly OKRs: Measurable goals that align with strategy
- Opportunity Solution Trees: Mapping problems to potential solutions
Tips for Effective Prioritization:
- Start with the "why" - what problem are you really solving? Why is this important to solve now for your users?
- A prioritization framework (such as RICE) is helpful to combat HiPPO (Highest Paid Person Opinion) issues but don't be a beholden to it. Prioritization requires looking at the full picture and making decisions - even if they seem irrational to someone on the outside
- Focus on one big bet per quarter - don't try to boil the ocean. You will do at best half of what you plan. It's ok.
Remember: There are only two criteria for product success:
- Does it solve a user's problem well?
- Does it help business move forward?
That's kind of it. Sorry 🤷🏻♂️

2. Discover: Problem Research and Solution Validation
- Activities: Customer Segmentation, Customer Interviews, JTBD Mapping
- Balancing problem discovery with solution validation
- Case study or example of successful problem research
This is where the rubber meets the road. Just like in data, garbage in = garbage out.
Key Activities:
- Customer Segmentation: Who exactly are we building for?
- Customer Interviews: What are their actual problems?
- Jobs To Be Done (JTBD) Mapping: What are they trying to accomplish?
The Discover phase is about balancing depth with speed. You're not writing a PhD thesis - you're trying to understand enough to take informed action. Get a sense of the use case and understand it deeply.
Case Study: Marketing Analytics Dashboard
When I was building analytics dashboards at a healthcare marketing agency, everyone wanted to "go big" - build flashy brand launches, complex visualizations, get perfect attribution, integrate external context.
But when we actually talked to users, they just wanted to answer simple questions:
- How are my campaigns performing?
- Where should I allocate budget?
- What's working and what's not?
Users don't "want the data" - they want insights and something to help them make progress in their decisions.

3. Design: Crafting the Product Experience
Design isn't just about making things pretty - it's about making them work. In healthcare tech, this is especially crucial. There is serious "low hanging fruit" in building intuitive data product interfaces and "giving people a dashboard" is not the answer.
Key Activities:
- UX Research: Understanding user workflows and pain points
- Design Sprints: Rapid ideation and validation
- High-fidelity Prototyping: Testing with real users
- Note: don't stop with 2-3 users, getting a diverse set of opinions from your customer personas needs to include 5-10 points of direct feedback. Don't lie to yourself.
The Iterative Process:
- Start simple
- Get feedback
- Refine
- Repeat
Pro tip: KISS (Keep It Simple, Stupid). Accept complexity when necessary, data products especially are by nature complex and you can't avoid this, but lean towards simplicity, design, and empathy. Run from "complicated".

4. Develop: Building and Preparing for Launch
Development is where ideas become reality. But remember - the goal isn't to build everything perfectly. It's to build enough to learn. Shoot for something that is Simple, Loveable, Complete.
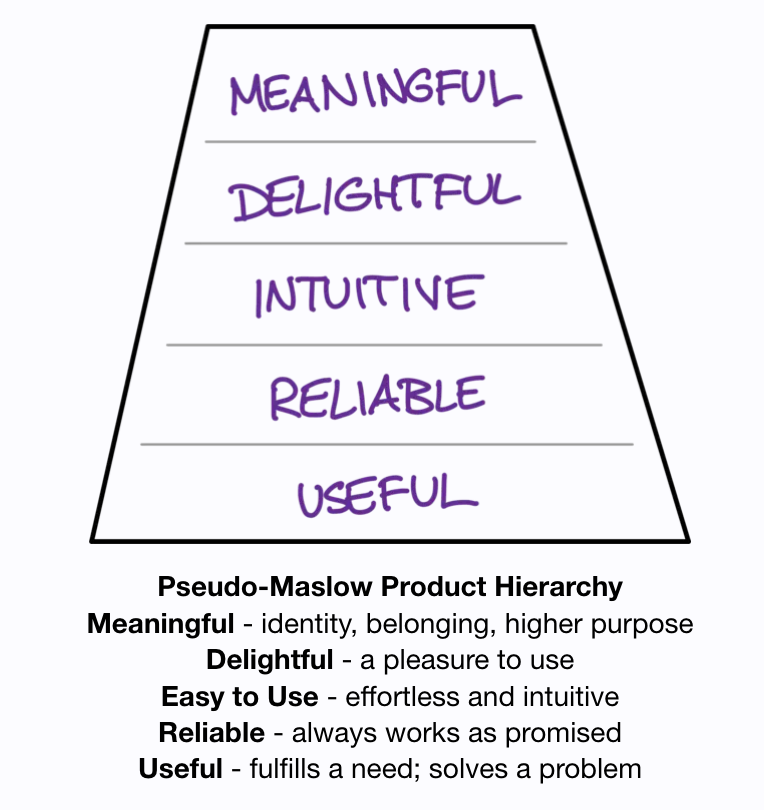
Key Activities:
- Story Mapping: Breaking down features into manageable chunks
- QA/DevOps: Ensuring quality and reliability
- UAT: Testing with real users
- Feature Go-to-Market Planning: Preparing for successful launch
Common Pitfalls:
- Over-engineering solutions
- Perfectionism paralysis
- Feature creep
- Forgetting about the end user
5. Decide: Analyzing and Improving
The final phase transforms instincts into evidence, where your data infrastructure proves its real value and insights drive action. Success here means implementing systematic feedback loops that actually inform product decisions, not just collecting data for data's sake.
Customer Interviews: Getting qualitative feedback
- Run structured exit interviews with churned customers while scheduling monthly power user deep-dives to understand what works and what doesn't
- Track feature requests and patterns in a searchable repository, capturing verbatim quotes that illuminate real user needs - Interview Snapshots are gold for sharing this with leadership and others
- Build and maintain systematic feedback loops that connect directly to product planning > back to the beginning. Connect feedback into the Define phase.
Product Metrics: Measuring what matters
- Focus on actionable metrics that drive decisions: time to first value, core action completion rates, feature adoption velocity, and engagement depth scores
- Skip the vanity metrics (if you can) and build real-time dashboards with clear next actions, implementing anomaly detection that catches issues before they become problems
- Connect every metric to a specific product or business outcome that matters
Cohort Analysis: Understanding behavior over time
- Map usage patterns to revenue outcomes and monitor product stickiness to understand what keeps users coming back
- Build cohort analyses that reveal which user characteristics and behaviors predict success
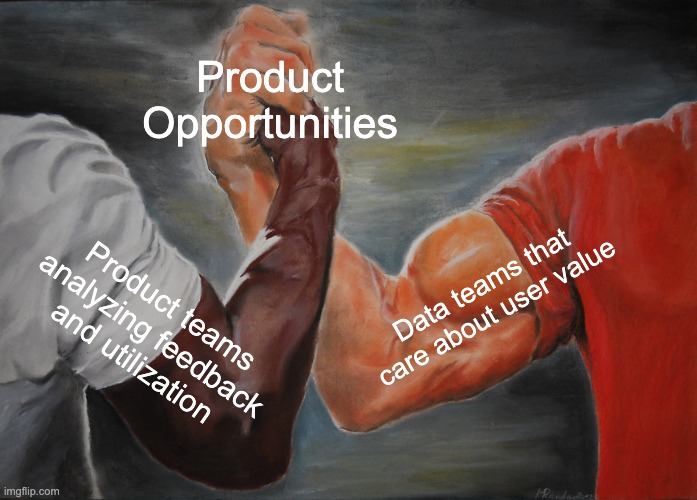
Implementing the 5D Product Framework
Use it. Don't use it. Copy. Adapt it.
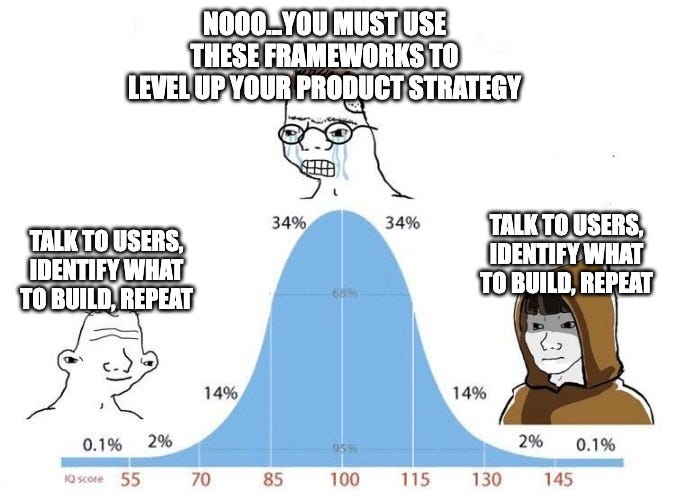
The goal is to "decide what to build", build it, and see if the market responds. Rinse and repeat.
Managing Uncertainty and Learning
- Strategies for reducing uncertainty throughout the product lifecycle
- How to maximize learning at each stage of development
- The role of experimentation and iteration in the 5D framework
Conclusion
Building products is hard. Building good products is harder. Building great products requires a framework that balances structure with flexibility.
The 5D Framework isn't perfect - no framework is. But it provides a path through the chaos, a way to manage the endless uncertainty of product development. It's helped me - hope it helps you.
Remember:
- Define, Discover, Design, Develop, Decide > repeat
- Data, LLMs, algorithms, systems aren't magic - they are tools
- Quality matters, especially in healthcare and other regulated industries
- Treat your users, data, and team well, and incredible things can happen
What's your take? How do you manage product development uncertainty? Let me know in the comments.
Additional Resources
Define
- Getting better at product strategy - Lennys Newsletter
- Product Strategy - Reforge
- Mission, Strategy, and Tactics - Boz
- Mission - Vision - Strategy - Goals - Roadmap - Tasks - Lennys Newsletter
Discover
Design
- PM - Design Partnership - Lennys Newsletter
- Building beautiful products - Katie Dill
- What is product design - Figma
Develop
- The engineering mindset - Will Larson
- Making better estimates with engineers - Jason Evanish
- Learning Track: Working with Developers - Technically Substack