ThinkHaven
An AI decision accelerator for people who have to turn a vague idea into a recommendation someone will sign off on. You grill your plan, you walk out with a shareable decision record, no signup required. The artifact is the product.
A decade in healthcare data taught me the problem is never the data. It’s what happens after the chart loads.
So I build the part that closes that gap. Three of those builds are running in public today. You can open any one of them from this page.
Most people in this line of work hand you a deck. Here are three working products instead. Click one, poke at it, decide for yourself.
An AI decision accelerator for people who have to turn a vague idea into a recommendation someone will sign off on. You grill your plan, you walk out with a shareable decision record, no signup required. The artifact is the product.
Ask US Census demographics a question in plain English and get an answer back in under two seconds. Built for healthcare strategy teams who don’t write SQL and shouldn’t have to.
An AI symptom checker that does one job: figure out your actual next step. Self-care, go see someone today, or an async review by a real ER physician. Co-founded with Jon Pangia, DO, who owns every clinical call.
Data teams drown in insight and starve for decisions. They can slice anything. And the decision still gets made in a Slack thread by someone who never opened the dashboard.
The gap isn’t analytical. It’s structural. Nobody built the thing that carries an insight into an actual call, with an owner and a date on it.
That structure is what I build. I wrote it down as DPOS, the Data Product Operating System, and I’ve been publishing the series as I go.
You have one AI agent workflow and an executive who has to say yes or no to production. In five business days I’ll tell you which it is, show you the evidence behind the call, and name what has to change first.
Proceed, proceed with conditions, or stop.
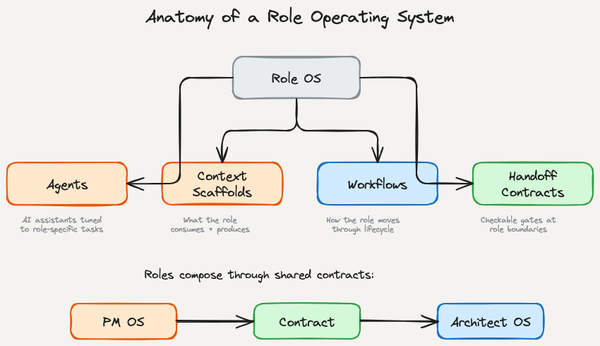
Intelligence is getting cheaper. Coordination is not. Role Operating Systems close the gap between individual productivity and team execution.
Read more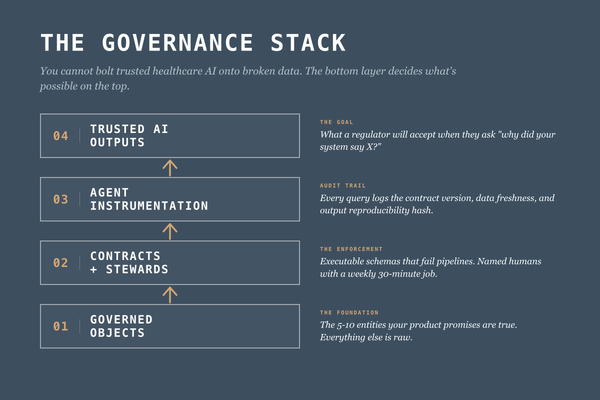
A practitioner's guide to governed objects, executable data contracts, stewardship that ships, and why catalogs won't save you in the agent era.
Read more
Part 2 of 5: The 15 principles that form the foundation of the Data Product Operating System. Seven philosophical beliefs about how data products work differently, and eight strategic principles for making decisions.
Read moreWhat I’m building, what broke, and what I’d do differently. Healthcare data products, decision infrastructure, and the messy middle of building alone.
No summaries of other people’s posts. No AI-generated filler.
No spam. Unsubscribe anytime.
If your team is shipping dashboards nobody opens, or sitting on an agent workflow nobody will sign off on, book thirty minutes. I’ll tell you honestly whether I’m useful here.